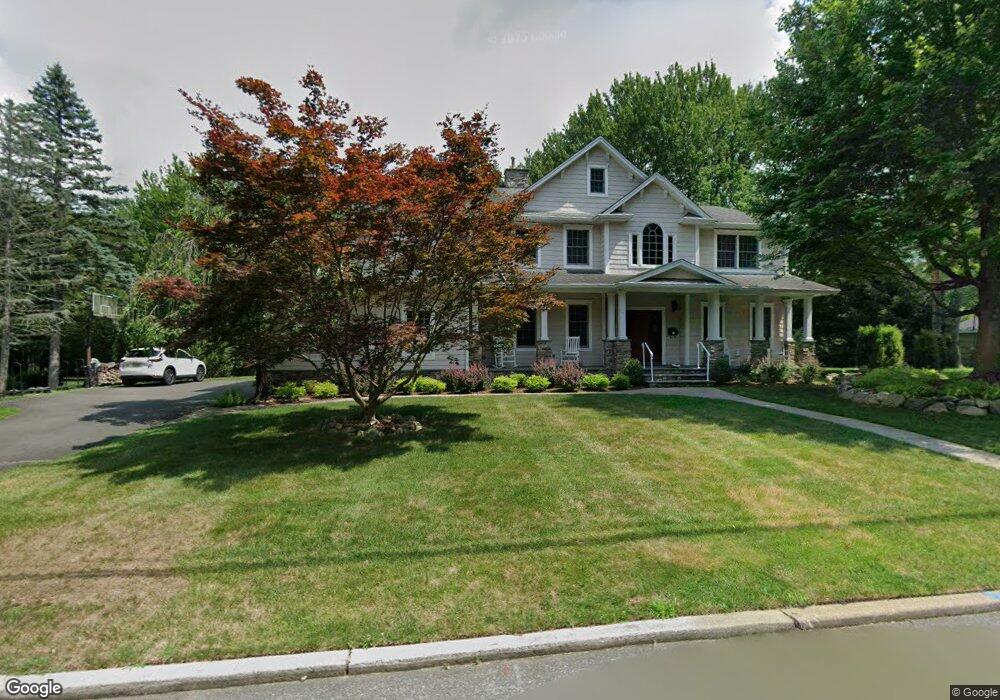
22 Kayeton Rd Allendale, NJ 07401
Estimated Value: $1,791,648 - $2,277,000
--
Bed
--
Bath
4,083
Sq Ft
$481/Sq Ft
Est. Value
About This Home
This home is located at 22 Kayeton Rd, Allendale, NJ 07401 and is currently estimated at $1,965,912, approximately $481 per square foot. 22 Kayeton Rd is a home located in Bergen County with nearby schools including Hillside Elementary School, Brookside Elementary School, and Northern Highlands Reg High School.
Ownership History
Date
Name
Owned For
Owner Type
Purchase Details
Closed on
Jun 13, 2007
Sold by
Paparozzi Frank J and Paparozzi Jo Ann
Bought by
Pataki Lester S and Pataki Jennifer E
Current Estimated Value
Home Financials for this Owner
Home Financials are based on the most recent Mortgage that was taken out on this home.
Original Mortgage
$1,280,000
Outstanding Balance
$783,225
Interest Rate
6.19%
Mortgage Type
New Conventional
Estimated Equity
$1,182,687
Create a Home Valuation Report for This Property
The Home Valuation Report is an in-depth analysis detailing your home's value as well as a comparison with similar homes in the area
Home Values in the Area
Average Home Value in this Area
Purchase History
| Date | Buyer | Sale Price | Title Company |
|---|---|---|---|
| Pataki Lester S | $1,670,000 | -- |
Source: Public Records
Mortgage History
| Date | Status | Borrower | Loan Amount |
|---|---|---|---|
| Open | Pataki Lester S | $1,280,000 |
Source: Public Records
Tax History Compared to Growth
Tax History
| Year | Tax Paid | Tax Assessment Tax Assessment Total Assessment is a certain percentage of the fair market value that is determined by local assessors to be the total taxable value of land and additions on the property. | Land | Improvement |
|---|---|---|---|---|
| 2025 | $28,098 | $1,392,000 | $457,200 | $934,800 |
| 2024 | $28,616 | $1,332,300 | $439,700 | $892,600 |
| 2023 | $28,141 | $1,301,300 | $429,700 | $871,600 |
| 2022 | $28,141 | $1,235,900 | $397,200 | $838,700 |
| 2021 | $28,179 | $1,199,600 | $382,200 | $817,400 |
| 2020 | $28,461 | $1,179,500 | $374,700 | $804,800 |
| 2019 | $27,706 | $1,179,500 | $374,700 | $804,800 |
| 2018 | $27,093 | $1,179,500 | $374,700 | $804,800 |
| 2017 | $26,987 | $1,179,500 | $374,700 | $804,800 |
| 2016 | $27,022 | $1,179,500 | $374,700 | $804,800 |
| 2015 | $26,480 | $1,179,500 | $374,700 | $804,800 |
| 2014 | $26,845 | $1,126,500 | $374,700 | $751,800 |
Source: Public Records
Map
Nearby Homes
- 10 Biscayne Dr
- 8 Oratam Rd
- 8 Garden Ct
- 5 Joseph Ct
- 193 S Franklin Turnpike
- 65 Lakeside Dr
- 48 Pleasant Ave
- 2 Allison Ct Unit C0002
- 356 E Allendale Ave
- 50 Elizabeth Terrace
- 17 Allison Ct
- 6 Cottage Place
- 10 E Allendale Rd
- 77 Myrtle Ave
- 64 Stoney Ridge Rd
- 3 Anne Ave
- 5 Burning Hollow Rd
- 22 Pembroke Trail
- 132 Prospect St
- 48 Lake St