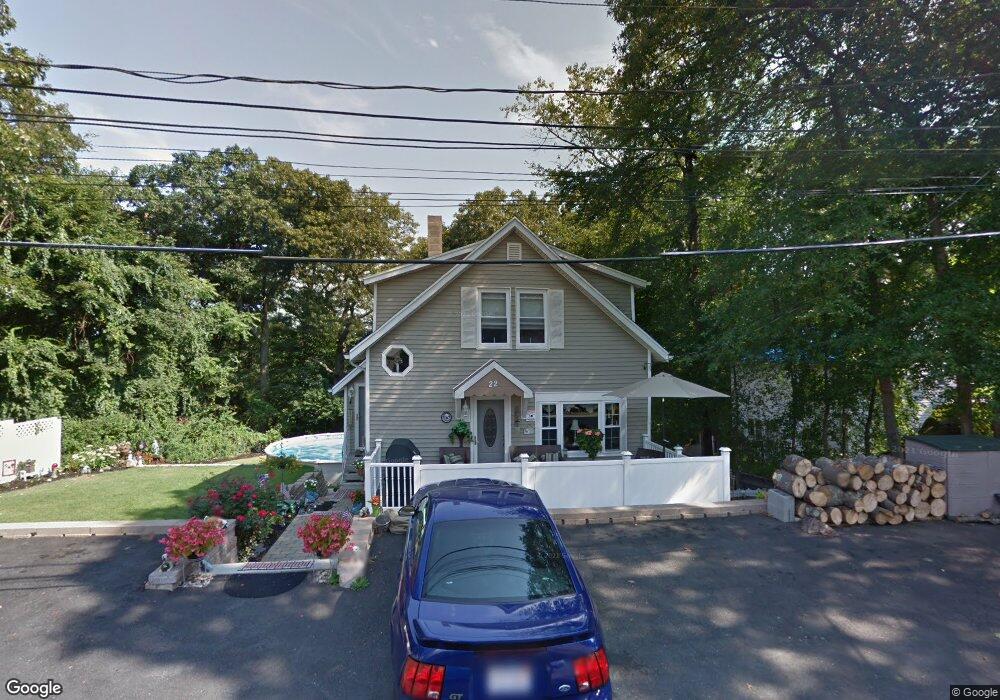
22 Lander St Saugus, MA 01906
Cliftondale NeighborhoodEstimated Value: $525,000 - $619,000
2
Beds
2
Baths
968
Sq Ft
$579/Sq Ft
Est. Value
About This Home
This home is located at 22 Lander St, Saugus, MA 01906 and is currently estimated at $560,726, approximately $579 per square foot. 22 Lander St is a home located in Essex County with nearby schools including Saugus High School, Pioneer Charter School Of Science II, and Sacred Heart School.
Ownership History
Date
Name
Owned For
Owner Type
Purchase Details
Closed on
Jun 8, 1993
Sold by
Perella Joanne
Bought by
Ayala Mariano and Ayala Linda
Current Estimated Value
Purchase Details
Closed on
Jul 23, 1991
Sold by
Trainor Donald T
Bought by
Perella Joanne A
Create a Home Valuation Report for This Property
The Home Valuation Report is an in-depth analysis detailing your home's value as well as a comparison with similar homes in the area
Home Values in the Area
Average Home Value in this Area
Purchase History
| Date | Buyer | Sale Price | Title Company |
|---|---|---|---|
| Ayala Mariano | $127,500 | -- | |
| Perella Joanne A | $129,900 | -- |
Source: Public Records
Mortgage History
| Date | Status | Borrower | Loan Amount |
|---|---|---|---|
| Open | Perella Joanne A | $20,514 | |
| Open | Perella Joanne A | $55,000 | |
| Open | Perella Joanne A | $240,000 |
Source: Public Records
Tax History
| Year | Tax Paid | Tax Assessment Tax Assessment Total Assessment is a certain percentage of the fair market value that is determined by local assessors to be the total taxable value of land and additions on the property. | Land | Improvement |
|---|---|---|---|---|
| 2025 | $5,289 | $495,200 | $299,200 | $196,000 |
| 2024 | $5,058 | $474,900 | $282,100 | $192,800 |
| 2023 | $4,916 | $436,600 | $247,900 | $188,700 |
| 2022 | $4,722 | $393,200 | $227,400 | $165,800 |
| 2021 | $4,339 | $351,600 | $197,500 | $154,100 |
| 2020 | $4,010 | $336,400 | $188,100 | $148,300 |
| 2019 | $3,889 | $319,300 | $171,000 | $148,300 |
| 2018 | $3,547 | $306,300 | $165,900 | $140,400 |
| 2017 | $3,294 | $273,400 | $154,700 | $118,700 |
| 2016 | $2,546 | $208,700 | $154,500 | $54,200 |
| 2015 | $2,388 | $198,700 | $147,100 | $51,600 |
| 2014 | $2,348 | $202,200 | $147,100 | $55,100 |
Source: Public Records
Map
Nearby Homes
- 360 Lincoln Ave
- 6 Saugus Ave Unit A
- 0 Hampton St
- 31 Mountain Ave
- 28 Naples Ave
- 25 Piedmont Ave
- 44 Ballard St
- 187 Hamilton St
- 10 Allison Rd
- 7 Adams Ave
- 25 Auburn St
- 36 Jasper St
- 20 Maple St
- 4 Oneil Way
- 32-34 Mount Vernon St
- 141 Essex St Unit B1
- 141 Essex St Unit D6
- 141 Essex St Unit B4
- 20 Palmer Ave
- 19 Laurel St
Your Personal Tour Guide
Ask me questions while you tour the home.