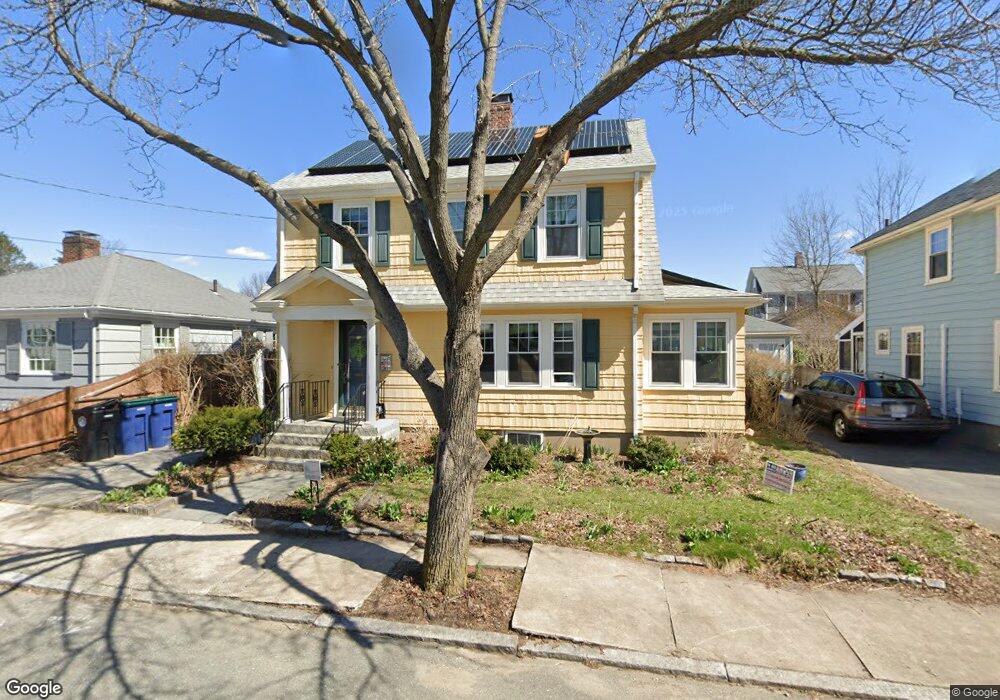
22 Larchmont Rd Salem, MA 01970
North Salem NeighborhoodEstimated Value: $803,000 - $902,000
3
Beds
2
Baths
2,015
Sq Ft
$426/Sq Ft
Est. Value
About This Home
This home is located at 22 Larchmont Rd, Salem, MA 01970 and is currently estimated at $857,848, approximately $425 per square foot. 22 Larchmont Rd is a home located in Essex County with nearby schools including Bates Elementary School, Saltonstall School, and Carlton Elementary School.
Ownership History
Date
Name
Owned For
Owner Type
Purchase Details
Closed on
Dec 22, 2015
Sold by
Bartlett-Hoskins John and Bradt Elizabeth S
Bought by
Elizabeth S Bradt T
Current Estimated Value
Purchase Details
Closed on
Apr 18, 1990
Sold by
Ethel V Macaulay Est
Bought by
Hoskins John Bartlett
Create a Home Valuation Report for This Property
The Home Valuation Report is an in-depth analysis detailing your home's value as well as a comparison with similar homes in the area
Home Values in the Area
Average Home Value in this Area
Purchase History
| Date | Buyer | Sale Price | Title Company |
|---|---|---|---|
| Elizabeth S Bradt T | -- | -- | |
| Hoskins John Bartlett | $165,000 | -- |
Source: Public Records
Mortgage History
| Date | Status | Borrower | Loan Amount |
|---|---|---|---|
| Previous Owner | Hoskins John Bartlett | $530,000 | |
| Previous Owner | Hoskins John Bartlett | $194,950 | |
| Previous Owner | Hoskins John Bartlett | $100,000 |
Source: Public Records
Tax History Compared to Growth
Tax History
| Year | Tax Paid | Tax Assessment Tax Assessment Total Assessment is a certain percentage of the fair market value that is determined by local assessors to be the total taxable value of land and additions on the property. | Land | Improvement |
|---|---|---|---|---|
| 2025 | $8,219 | $724,800 | $198,200 | $526,600 |
| 2024 | $8,136 | $700,200 | $198,200 | $502,000 |
| 2023 | $7,684 | $614,200 | $180,400 | $433,800 |
| 2022 | $7,070 | $533,600 | $180,400 | $353,200 |
| 2021 | $6,948 | $503,500 | $180,400 | $323,100 |
| 2020 | $6,579 | $455,300 | $161,500 | $293,800 |
| 2019 | $5,980 | $396,000 | $161,500 | $234,500 |
| 2018 | $5,795 | $376,800 | $153,800 | $223,000 |
| 2017 | $5,659 | $356,800 | $142,000 | $214,800 |
| 2016 | $5,591 | $356,800 | $142,000 | $214,800 |
| 2015 | $5,653 | $344,500 | $142,000 | $202,500 |
Source: Public Records
Map
Nearby Homes
- 5 Larchmont Rd Unit 3
- 41 Dearborn St
- 29R Upham St
- 29R Upham St Unit 29R
- 27 Appleton St
- 18 Franklin St Unit 303
- 112 North St
- 3 S Mason St
- 103 Bridge St Unit 2
- 19 Cushing St
- 12 Thorndike St
- 156 Bridge St Unit B
- 14 Lathrop St
- 0 Lot 41 Map 10 Unit 73335079
- 0 Lot 61 Map 10 Unit 73335091
- 78 Federal St
- 47 Federal St
- 14 Margin St
- 36 Irving St Unit B
- 17 North St Unit 2