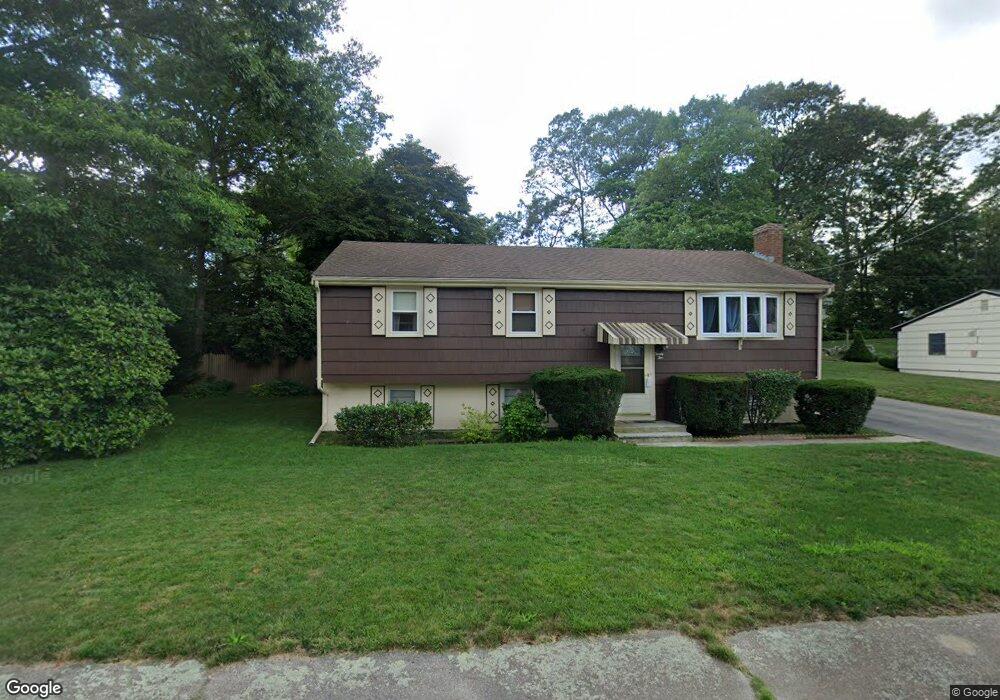
22 Laura Ln Stoughton, MA 02072
Estimated Value: $560,794 - $691,000
3
Beds
2
Baths
1,562
Sq Ft
$393/Sq Ft
Est. Value
About This Home
This home is located at 22 Laura Ln, Stoughton, MA 02072 and is currently estimated at $614,199, approximately $393 per square foot. 22 Laura Ln is a home located in Norfolk County with nearby schools including South Elementary School, Dr. Robert G. O'Donnell Middle School, and Stoughton High School.
Ownership History
Date
Name
Owned For
Owner Type
Purchase Details
Closed on
Aug 2, 2005
Sold by
Civitarese Alice L and Civitarese Richard T
Bought by
Davis Kathy Ann and Davis Kevin M
Current Estimated Value
Home Financials for this Owner
Home Financials are based on the most recent Mortgage that was taken out on this home.
Original Mortgage
$315,000
Outstanding Balance
$163,495
Interest Rate
5.67%
Mortgage Type
Purchase Money Mortgage
Estimated Equity
$450,704
Create a Home Valuation Report for This Property
The Home Valuation Report is an in-depth analysis detailing your home's value as well as a comparison with similar homes in the area
Home Values in the Area
Average Home Value in this Area
Purchase History
| Date | Buyer | Sale Price | Title Company |
|---|---|---|---|
| Davis Kathy Ann | $380,000 | -- | |
| Davis Kathy Ann | $380,000 | -- |
Source: Public Records
Mortgage History
| Date | Status | Borrower | Loan Amount |
|---|---|---|---|
| Open | Davis Kathy Ann | $315,000 | |
| Closed | Davis Kathy Ann | $315,000 | |
| Previous Owner | Davis Kathy Ann | $99,200 |
Source: Public Records
Tax History Compared to Growth
Tax History
| Year | Tax Paid | Tax Assessment Tax Assessment Total Assessment is a certain percentage of the fair market value that is determined by local assessors to be the total taxable value of land and additions on the property. | Land | Improvement |
|---|---|---|---|---|
| 2025 | $5,939 | $479,700 | $222,200 | $257,500 |
| 2024 | $5,750 | $451,700 | $203,000 | $248,700 |
| 2023 | $5,530 | $408,100 | $185,500 | $222,600 |
| 2022 | $5,647 | $391,900 | $178,500 | $213,400 |
| 2021 | $5,373 | $355,800 | $157,500 | $198,300 |
| 2020 | $5,183 | $348,100 | $157,500 | $190,600 |
| 2019 | $5,231 | $341,000 | $157,500 | $183,500 |
| 2018 | $4,579 | $309,200 | $150,500 | $158,700 |
| 2017 | $4,389 | $302,900 | $148,700 | $154,200 |
| 2016 | $4,183 | $279,400 | $134,700 | $144,700 |
| 2015 | $4,121 | $272,400 | $127,700 | $144,700 |
| 2014 | $4,014 | $255,000 | $117,200 | $137,800 |
Source: Public Records
Map
Nearby Homes
- 93 McEachron Dr
- 48 Sofia Rd
- 0 Atkinson Ave
- 511 Sumner St
- 434 Sumner St
- 38 Brickel Rd
- 14 Marshall Rd
- 86 Union St
- 110 Union St
- 57 Whitney Ave
- Lot 1 Winterberry Ln
- LOT 4 Winterberry Ln
- Lot 2 Winterberry Ln
- 33 Belmont Ave
- Lot 8 Lawler Ln
- 483 Park St
- 250 Morton St
- 51 Rangeley Ave
- 261 Park St
- 73 Crescent Ave