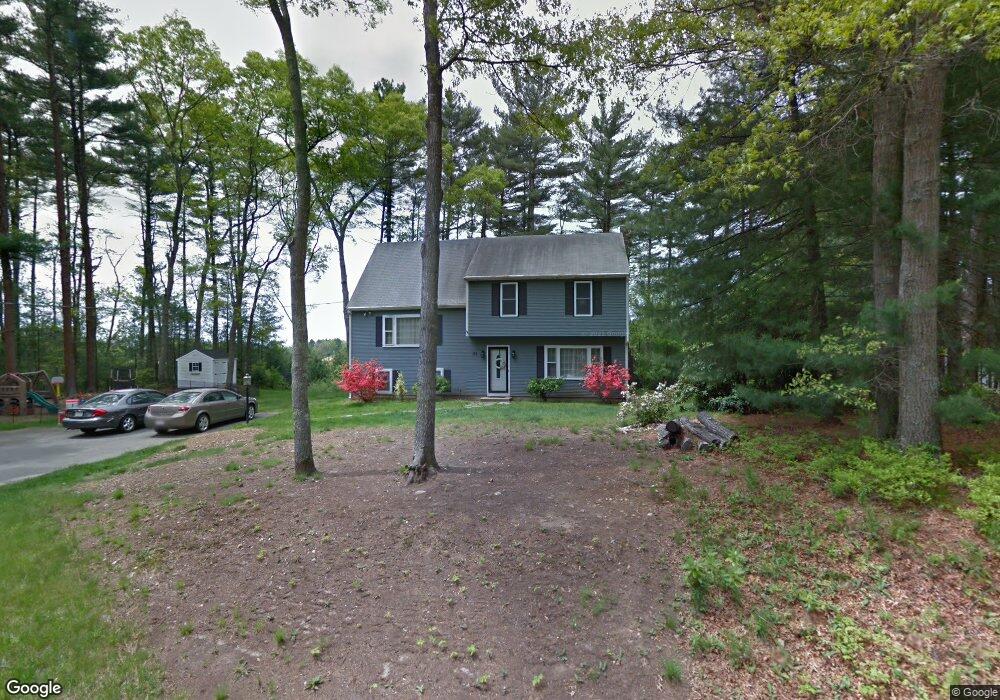
22 Leonard St Carver, MA 02330
Estimated Value: $641,368 - $697,000
4
Beds
3
Baths
2,040
Sq Ft
$332/Sq Ft
Est. Value
About This Home
This home is located at 22 Leonard St, Carver, MA 02330 and is currently estimated at $676,842, approximately $331 per square foot. 22 Leonard St is a home located in Plymouth County with nearby schools including Carver Elementary School and Carver Middle/High School.
Ownership History
Date
Name
Owned For
Owner Type
Purchase Details
Closed on
Jun 29, 2007
Sold by
Gale Alan A and Gale Susan M
Bought by
Dandrea Brandon M and Dandrea Michelle L
Current Estimated Value
Home Financials for this Owner
Home Financials are based on the most recent Mortgage that was taken out on this home.
Original Mortgage
$277,520
Outstanding Balance
$167,795
Interest Rate
6.24%
Mortgage Type
Purchase Money Mortgage
Estimated Equity
$509,047
Purchase Details
Closed on
Aug 2, 1991
Sold by
Valorz Steven D and Valorz Beth A
Bought by
Gale Alan A and Gale Susan M
Purchase Details
Closed on
Jul 31, 1987
Sold by
Village Homes Inc
Bought by
Valorz Steven D
Create a Home Valuation Report for This Property
The Home Valuation Report is an in-depth analysis detailing your home's value as well as a comparison with similar homes in the area
Home Values in the Area
Average Home Value in this Area
Purchase History
| Date | Buyer | Sale Price | Title Company |
|---|---|---|---|
| Dandrea Brandon M | $346,900 | -- | |
| Gale Alan A | $149,900 | -- | |
| Valorz Steven D | $185,080 | -- |
Source: Public Records
Mortgage History
| Date | Status | Borrower | Loan Amount |
|---|---|---|---|
| Open | Valorz Steven D | $277,520 | |
| Closed | Valorz Steven D | $69,380 |
Source: Public Records
Tax History
| Year | Tax Paid | Tax Assessment Tax Assessment Total Assessment is a certain percentage of the fair market value that is determined by local assessors to be the total taxable value of land and additions on the property. | Land | Improvement |
|---|---|---|---|---|
| 2025 | $7,427 | $535,500 | $142,300 | $393,200 |
| 2024 | $7,037 | $496,600 | $139,600 | $357,000 |
| 2023 | $6,758 | $463,200 | $139,600 | $323,600 |
| 2022 | $6,424 | $402,000 | $119,300 | $282,700 |
| 2021 | $6,297 | $371,700 | $106,500 | $265,200 |
| 2020 | $8,952 | $351,900 | $99,600 | $252,300 |
| 2019 | $9,545 | $352,000 | $96,700 | $255,300 |
| 2018 | $5,800 | $329,000 | $96,700 | $232,300 |
| 2017 | $5,028 | $321,700 | $93,000 | $228,700 |
| 2016 | $5,279 | $310,000 | $88,600 | $221,400 |
| 2015 | $5,064 | $297,700 | $88,600 | $209,100 |
| 2014 | $4,867 | $286,100 | $112,000 | $174,100 |
Source: Public Records
Map
Nearby Homes
Your Personal Tour Guide
Ask me questions while you tour the home.