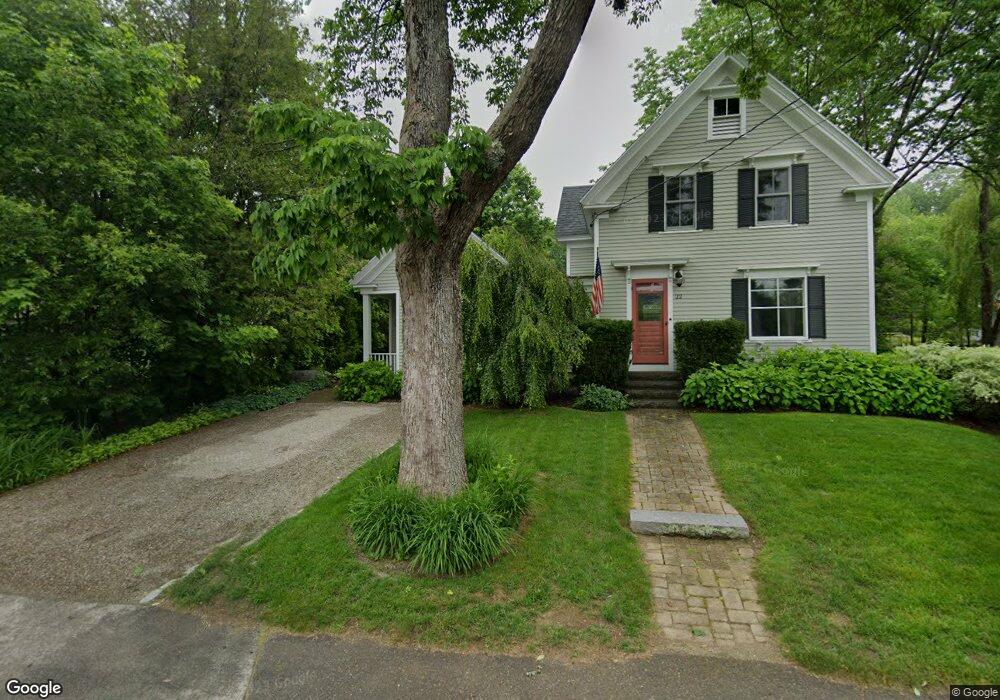
22 Limerock St Camden, ME 04843
Estimated Value: $734,000 - $943,000
3
Beds
2
Baths
1,562
Sq Ft
$526/Sq Ft
Est. Value
About This Home
This home is located at 22 Limerock St, Camden, ME 04843 and is currently estimated at $822,147, approximately $526 per square foot. 22 Limerock St is a home located in Knox County with nearby schools including Camden-Rockport Elementary School, Camden-Rockport Middle School, and Camden Hills Regional High School.
Ownership History
Date
Name
Owned For
Owner Type
Purchase Details
Closed on
Jul 19, 2018
Sold by
Murray Jamie L and Murray Glenn A
Bought by
Murray Ft
Current Estimated Value
Purchase Details
Closed on
Oct 25, 2007
Sold by
Mcleod Bradley J and Mcleod Jack W
Bought by
Murray Glenn A and Murray Jamie L
Home Financials for this Owner
Home Financials are based on the most recent Mortgage that was taken out on this home.
Original Mortgage
$223,200
Outstanding Balance
$109,412
Interest Rate
6.39%
Mortgage Type
Purchase Money Mortgage
Estimated Equity
$712,735
Create a Home Valuation Report for This Property
The Home Valuation Report is an in-depth analysis detailing your home's value as well as a comparison with similar homes in the area
Home Values in the Area
Average Home Value in this Area
Purchase History
| Date | Buyer | Sale Price | Title Company |
|---|---|---|---|
| Murray Ft | -- | -- | |
| Murray Glenn A | -- | -- |
Source: Public Records
Mortgage History
| Date | Status | Borrower | Loan Amount |
|---|---|---|---|
| Open | Murray Glenn A | $223,200 |
Source: Public Records
Tax History Compared to Growth
Tax History
| Year | Tax Paid | Tax Assessment Tax Assessment Total Assessment is a certain percentage of the fair market value that is determined by local assessors to be the total taxable value of land and additions on the property. | Land | Improvement |
|---|---|---|---|---|
| 2024 | $6,630 | $631,400 | $201,300 | $430,100 |
| 2023 | $6,309 | $457,200 | $119,500 | $337,700 |
| 2022 | $6,035 | $457,200 | $119,500 | $337,700 |
| 2021 | $5,633 | $367,000 | $92,800 | $274,200 |
| 2020 | $5,516 | $367,000 | $92,800 | $274,200 |
| 2019 | $5,472 | $367,000 | $92,800 | $274,200 |
| 2018 | $4,912 | $330,100 | $105,500 | $224,600 |
| 2017 | $4,747 | $330,100 | $105,500 | $224,600 |
| 2016 | $3,826 | $245,400 | $69,400 | $176,000 |
| 2015 | $3,713 | $245,400 | $69,400 | $176,000 |
| 2014 | $3,541 | $245,400 | $69,400 | $176,000 |
| 2013 | $3,445 | $245,400 | $69,400 | $176,000 |
Source: Public Records
Map
Nearby Homes