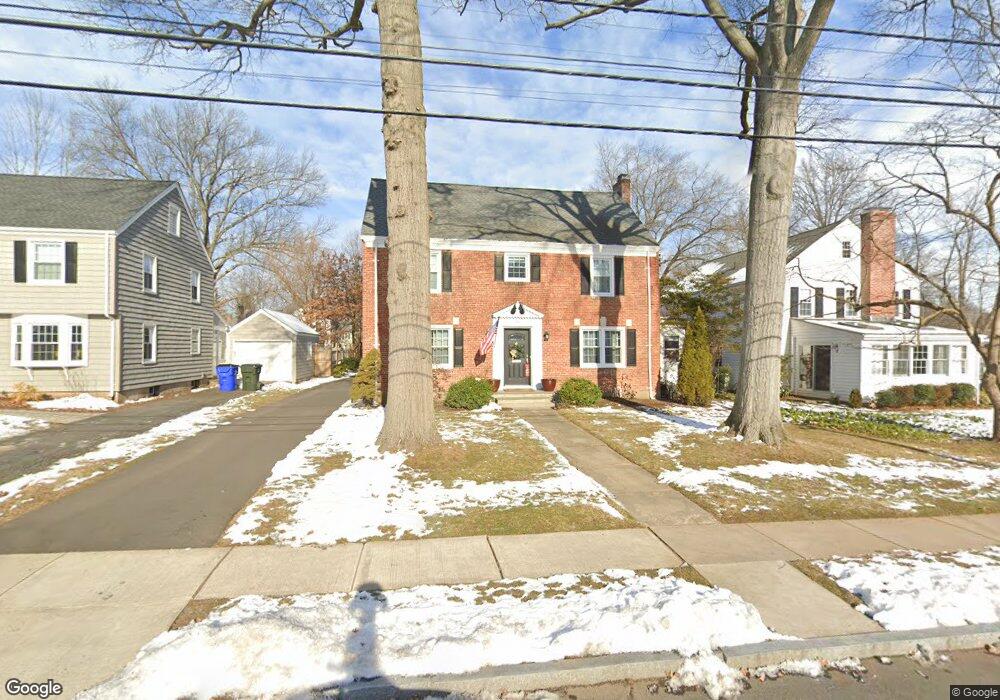
22 Linnard Rd West Hartford, CT 06107
Estimated Value: $631,000 - $791,000
4
Beds
3
Baths
2,180
Sq Ft
$324/Sq Ft
Est. Value
About This Home
This home is located at 22 Linnard Rd, West Hartford, CT 06107 and is currently estimated at $706,526, approximately $324 per square foot. 22 Linnard Rd is a home located in Hartford County with nearby schools including Bugbee School, King Philip Middle School, and Hall High School.
Ownership History
Date
Name
Owned For
Owner Type
Purchase Details
Closed on
Jun 27, 2011
Sold by
Lampreia Dora M and Gumula Kenneth
Bought by
Landry Eric S and Landry Lindsay H
Current Estimated Value
Home Financials for this Owner
Home Financials are based on the most recent Mortgage that was taken out on this home.
Original Mortgage
$349,960
Interest Rate
4.63%
Purchase Details
Closed on
Nov 24, 2003
Sold by
National Res Nomn Svc
Bought by
Lampreia Dora M and Gumula Kenneth
Home Financials for this Owner
Home Financials are based on the most recent Mortgage that was taken out on this home.
Original Mortgage
$165,000
Interest Rate
5.98%
Purchase Details
Closed on
Sep 26, 2002
Sold by
Widness Edward M and Widness Marjorie M
Bought by
Holden Carolyn J
Home Financials for this Owner
Home Financials are based on the most recent Mortgage that was taken out on this home.
Original Mortgage
$320,000
Interest Rate
5.5%
Purchase Details
Closed on
Jul 21, 1988
Sold by
Delaney J E
Bought by
Widness E M
Create a Home Valuation Report for This Property
The Home Valuation Report is an in-depth analysis detailing your home's value as well as a comparison with similar homes in the area
Home Values in the Area
Average Home Value in this Area
Purchase History
| Date | Buyer | Sale Price | Title Company |
|---|---|---|---|
| Landry Eric S | $437,450 | -- | |
| Lampreia Dora M | $380,000 | -- | |
| Natl Res Nominee Svcs | $382,500 | -- | |
| Holden Carolyn J | $400,000 | -- | |
| Widness E M | $320,000 | -- |
Source: Public Records
Mortgage History
| Date | Status | Borrower | Loan Amount |
|---|---|---|---|
| Open | Widness E M | $347,300 | |
| Closed | Widness E M | $349,960 | |
| Previous Owner | Widness E M | $165,000 | |
| Previous Owner | Widness E M | $320,000 |
Source: Public Records
Tax History Compared to Growth
Tax History
| Year | Tax Paid | Tax Assessment Tax Assessment Total Assessment is a certain percentage of the fair market value that is determined by local assessors to be the total taxable value of land and additions on the property. | Land | Improvement |
|---|---|---|---|---|
| 2025 | $13,310 | $297,220 | $123,270 | $173,950 |
| 2024 | $12,587 | $297,220 | $123,270 | $173,950 |
| 2023 | $12,162 | $297,220 | $123,270 | $173,950 |
| 2022 | $12,091 | $297,220 | $123,270 | $173,950 |
| 2021 | $11,346 | $267,470 | $123,270 | $144,200 |
| 2020 | $11,116 | $265,930 | $125,300 | $140,630 |
| 2019 | $11,116 | $265,930 | $125,300 | $140,630 |
| 2018 | $10,903 | $265,930 | $125,300 | $140,630 |
| 2017 | $10,822 | $263,690 | $125,300 | $138,390 |
| 2016 | $10,272 | $259,980 | $107,730 | $152,250 |
| 2015 | $9,960 | $259,980 | $107,730 | $152,250 |
| 2014 | $9,715 | $259,980 | $107,730 | $152,250 |
Source: Public Records
Map
Nearby Homes
- 132 N Main St
- 1272 Trout Brook Dr
- 1110 Trout Brook Dr
- 105 Ardmore Rd
- 183 Loomis Dr Unit 109
- 54 Robin Rd Unit B2
- 59 Milton St
- 1006A Trout Brook Dr Unit 1006A
- 869 Farmington Ave Unit 305
- 11 Lawler Rd
- 48 Walkley Rd
- 16 Lilley Rd
- 237 Fern St Unit 314
- 62 Blue Ridge Ln
- 56 Fox Chase Ln
- 85 Memorial Rd Unit 512
- 2 Arapahoe Rd Unit 313
- 2 Arapahoe Rd Unit 308
- 2 Arapahoe Rd Unit 611
- 2 Arapahoe Rd Unit 601