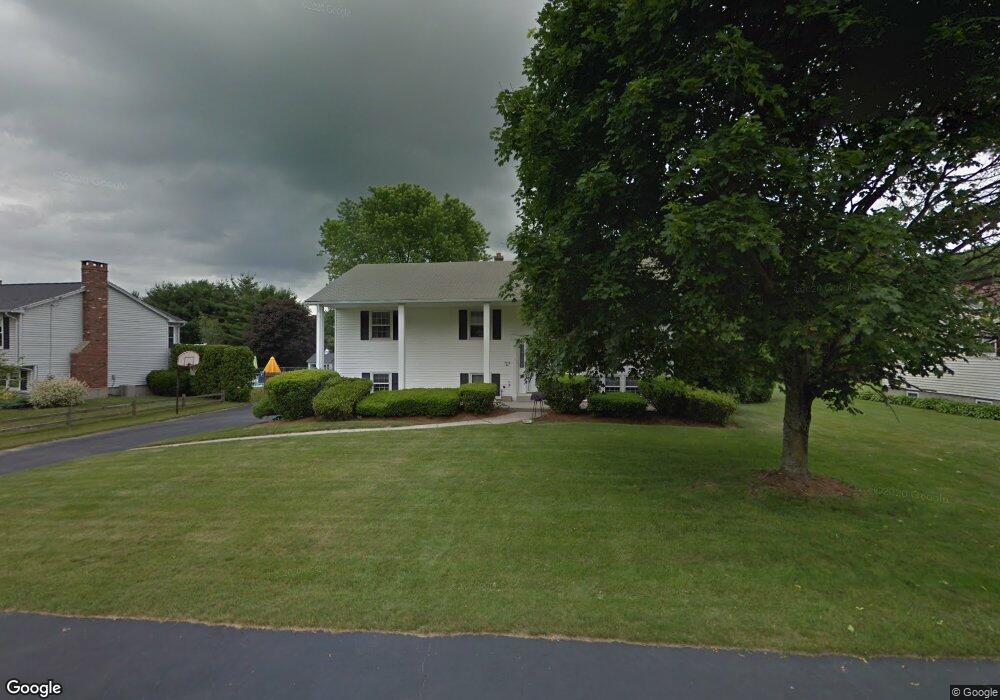
22 Lorna Dr Auburn, MA 01501
Stoneville NeighborhoodEstimated Value: $527,000 - $610,000
3
Beds
3
Baths
1,510
Sq Ft
$368/Sq Ft
Est. Value
About This Home
This home is located at 22 Lorna Dr, Auburn, MA 01501 and is currently estimated at $556,342, approximately $368 per square foot. 22 Lorna Dr is a home located in Worcester County with nearby schools including Auburn Senior High School and Shrewsbury Montessori School - Auburn Campus.
Ownership History
Date
Name
Owned For
Owner Type
Purchase Details
Closed on
May 17, 2021
Sold by
Nicholson Richard
Bought by
Nicholson Richard and Nicholson Heidi A
Current Estimated Value
Purchase Details
Closed on
Apr 2, 2021
Sold by
Nicholson Roberta Est
Bought by
Nicholson Richard
Purchase Details
Closed on
Dec 19, 1978
Bought by
Nicholson Richard
Create a Home Valuation Report for This Property
The Home Valuation Report is an in-depth analysis detailing your home's value as well as a comparison with similar homes in the area
Home Values in the Area
Average Home Value in this Area
Purchase History
| Date | Buyer | Sale Price | Title Company |
|---|---|---|---|
| Nicholson Richard | -- | None Available | |
| Nicholson Richard | $150,000 | None Available | |
| Nicholson Richard | $48,000 | -- |
Source: Public Records
Mortgage History
| Date | Status | Borrower | Loan Amount |
|---|---|---|---|
| Previous Owner | Nicholson Richard | $100,000 | |
| Previous Owner | Nicholson Richard | $28,000 | |
| Previous Owner | Nicholson Richard | $28,000 |
Source: Public Records
Tax History Compared to Growth
Tax History
| Year | Tax Paid | Tax Assessment Tax Assessment Total Assessment is a certain percentage of the fair market value that is determined by local assessors to be the total taxable value of land and additions on the property. | Land | Improvement |
|---|---|---|---|---|
| 2025 | $75 | $522,100 | $128,900 | $393,200 |
| 2024 | $7,278 | $487,500 | $124,100 | $363,400 |
| 2023 | $6,957 | $438,100 | $112,900 | $325,200 |
| 2022 | $6,445 | $383,200 | $112,900 | $270,300 |
| 2021 | $6,269 | $345,600 | $99,700 | $245,900 |
| 2020 | $6,214 | $345,600 | $99,700 | $245,900 |
| 2019 | $10,387 | $327,100 | $98,800 | $228,300 |
| 2018 | $5,960 | $323,200 | $92,400 | $230,800 |
| 2017 | $5,684 | $309,900 | $83,800 | $226,100 |
| 2016 | $5,517 | $305,000 | $86,500 | $218,500 |
| 2015 | $4,757 | $275,600 | $86,500 | $189,100 |
| 2014 | $4,578 | $264,800 | $82,200 | $182,600 |
Source: Public Records
Map
Nearby Homes
- 1-9 Helens Way
- 177 Oxford St N
- 19-20 Williams St
- 177 Boyce St
- 176 Boyce St
- 27 Havana Rd
- 25 Vinal St Unit 26
- 25 Vinal St Unit 29
- 25 Vinal St Unit 30
- 2 Keen St
- 5 Commonwealth Ave
- 315 Stafford St
- 34 Rockland Rd
- 8 Shirley St
- 11 Inwood Rd
- 3 Old Cart Rd
- 53 James St
- 4 S Edlin St
- Lot 2 Leicester St
- 33 Walsh Ave