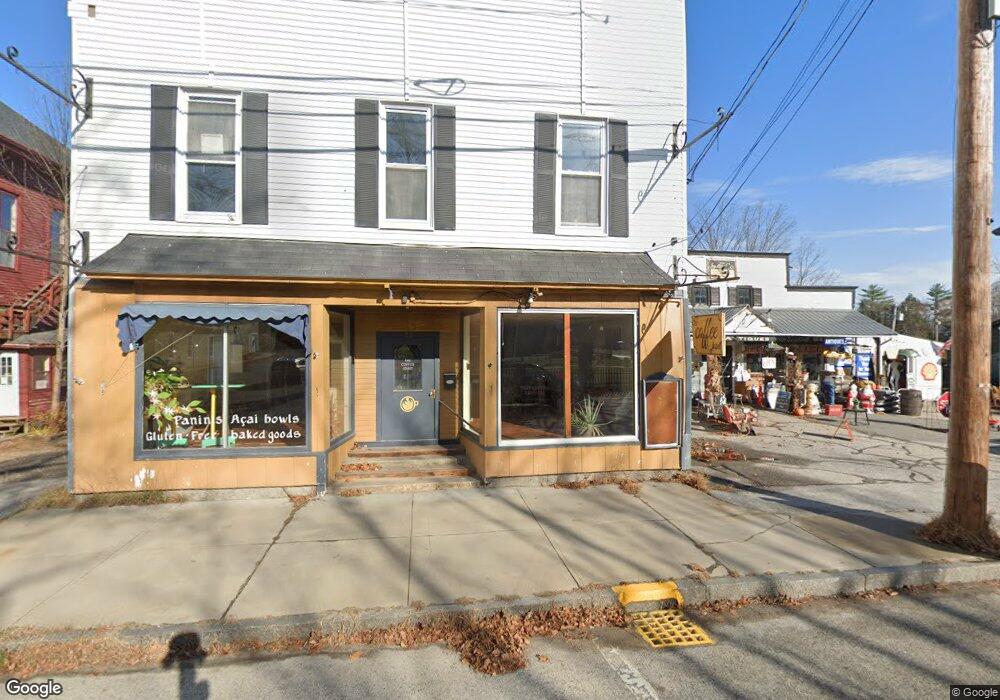
22 Main St Cornish, ME 04020
Estimated Value: $307,204
Studio
--
Bath
4,311
Sq Ft
$71/Sq Ft
Est. Value
About This Home
This home is located at 22 Main St, Cornish, ME 04020 and is currently priced at $307,204, approximately $71 per square foot. 22 Main St is a home located in York County.
Ownership History
Date
Name
Owned For
Owner Type
Purchase Details
Closed on
Dec 14, 2015
Sold by
Libby Huard A and Libby Rosemary D
Bought by
Dandy Sarah Farm Llc
Current Estimated Value
Purchase Details
Closed on
Jun 1, 2015
Sold by
Copp Hld Llc
Bought by
Libby Rosemary D and Libby Huard A
Purchase Details
Closed on
Oct 10, 2013
Sold by
Libby Rosemary D and Libby Huard A
Bought by
Copp Holding Llc
Home Financials for this Owner
Home Financials are based on the most recent Mortgage that was taken out on this home.
Original Mortgage
$150,000
Interest Rate
4.53%
Mortgage Type
Commercial
Create a Home Valuation Report for This Property
The Home Valuation Report is an in-depth analysis detailing your home's value as well as a comparison with similar homes in the area
Home Values in the Area
Average Home Value in this Area
Purchase History
| Date | Buyer | Sale Price | Title Company |
|---|---|---|---|
| Dandy Sarah Farm Llc | -- | -- | |
| Libby Rosemary D | -- | -- | |
| Copp Holding Llc | -- | -- |
Source: Public Records
Mortgage History
| Date | Status | Borrower | Loan Amount |
|---|---|---|---|
| Previous Owner | Copp Holding Llc | $150,000 |
Source: Public Records
Tax History
| Year | Tax Paid | Tax Assessment Tax Assessment Total Assessment is a certain percentage of the fair market value that is determined by local assessors to be the total taxable value of land and additions on the property. | Land | Improvement |
|---|---|---|---|---|
| 2025 | $4,508 | $477,000 | $43,300 | $433,700 |
| 2024 | $4,736 | $514,800 | $81,100 | $433,700 |
| 2023 | $3,980 | $278,300 | $38,200 | $240,100 |
| 2022 | $3,841 | $278,300 | $38,200 | $240,100 |
| 2021 | $3,757 | $278,300 | $38,200 | $240,100 |
| 2020 | $3,729 | $278,300 | $38,200 | $240,100 |
| 2019 | $2,921 | $278,300 | $38,200 | $240,100 |
| 2018 | $3,757 | $278,300 | $38,200 | $240,100 |
| 2016 | $3,587 | $278,300 | $38,200 | $240,100 |
| 2015 | $3,590 | $278,300 | $38,200 | $240,100 |
| 2014 | -- | $278,300 | $38,200 | $240,100 |
Source: Public Records
Map
Nearby Homes
- 20 Main St
- 4 Bridge St
- 96 Maple St
- 6-13 Main St
- Lot #3 Jordan Heights Rd
- Lot #2 Jordan Heights Rd
- Lot #8 Jordan Heights Rd
- Lot #4 Jordan Heights Rd
- 490 S Hiram Rd
- 0 Durgintown Rd
- 992 Pequawket Trail
- 198 Senator Black Rd
- TBD Sokokis Trail N
- 174 Marston Rd
- 5 Kimball Hill Rd
- 12 Main St
- 8 Graffam Rd
- 8 - A Graffam Rd
- 30 Graffam Rd
- 482 Ossipee Trail
Your Personal Tour Guide
Ask me questions while you tour the home.