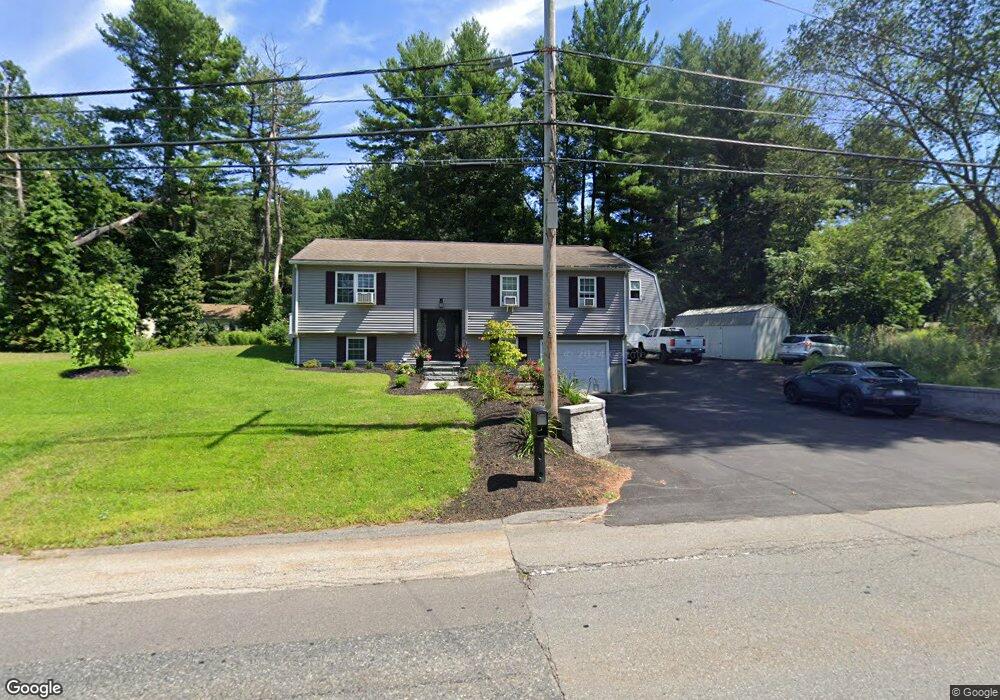
22 Main St Oxford, MA 01540
Estimated Value: $421,000 - $462,000
3
Beds
1
Bath
1,092
Sq Ft
$404/Sq Ft
Est. Value
About This Home
This home is located at 22 Main St, Oxford, MA 01540 and is currently estimated at $440,754, approximately $403 per square foot. 22 Main St is a home located in Worcester County with nearby schools including Alfred M Chaffee, Oxford High School, and Clara Barton Elementary School.
Ownership History
Date
Name
Owned For
Owner Type
Purchase Details
Closed on
May 3, 2006
Sold by
Labouef Sean R
Bought by
Labouef Sherri A
Current Estimated Value
Home Financials for this Owner
Home Financials are based on the most recent Mortgage that was taken out on this home.
Original Mortgage
$181,800
Outstanding Balance
$104,929
Interest Rate
6.34%
Mortgage Type
Purchase Money Mortgage
Estimated Equity
$335,825
Purchase Details
Closed on
Mar 10, 2000
Sold by
Renauld Theodore J
Bought by
Labouef Sean R and Labouef Sherri A
Home Financials for this Owner
Home Financials are based on the most recent Mortgage that was taken out on this home.
Original Mortgage
$100,000
Interest Rate
8.18%
Mortgage Type
Purchase Money Mortgage
Create a Home Valuation Report for This Property
The Home Valuation Report is an in-depth analysis detailing your home's value as well as a comparison with similar homes in the area
Home Values in the Area
Average Home Value in this Area
Purchase History
| Date | Buyer | Sale Price | Title Company |
|---|---|---|---|
| Labouef Sherri A | -- | -- | |
| Labouef Sean R | $125,000 | -- |
Source: Public Records
Mortgage History
| Date | Status | Borrower | Loan Amount |
|---|---|---|---|
| Open | Labouef Sherri A | $181,800 | |
| Previous Owner | Labouef Sean R | $25,000 | |
| Previous Owner | Labouef Sean R | $102,000 | |
| Previous Owner | Labouef Sean R | $100,000 |
Source: Public Records
Tax History Compared to Growth
Tax History
| Year | Tax Paid | Tax Assessment Tax Assessment Total Assessment is a certain percentage of the fair market value that is determined by local assessors to be the total taxable value of land and additions on the property. | Land | Improvement |
|---|---|---|---|---|
| 2025 | $48 | $379,400 | $85,500 | $293,900 |
| 2024 | $4,586 | $340,200 | $81,900 | $258,300 |
| 2023 | $4,473 | $327,900 | $69,600 | $258,300 |
| 2022 | $4,462 | $276,100 | $67,800 | $208,300 |
| 2021 | $4,337 | $262,400 | $64,500 | $197,900 |
| 2020 | $4,388 | $263,400 | $64,500 | $198,900 |
| 2019 | $3,920 | $230,200 | $63,900 | $166,300 |
| 2018 | $3,478 | $201,400 | $63,900 | $137,500 |
| 2017 | $3,488 | $207,000 | $63,900 | $143,100 |
| 2016 | $3,505 | $207,000 | $63,900 | $143,100 |
| 2015 | $3,269 | $207,000 | $63,900 | $143,100 |
| 2014 | $3,216 | $214,400 | $63,900 | $150,500 |
Source: Public Records
Map
Nearby Homes