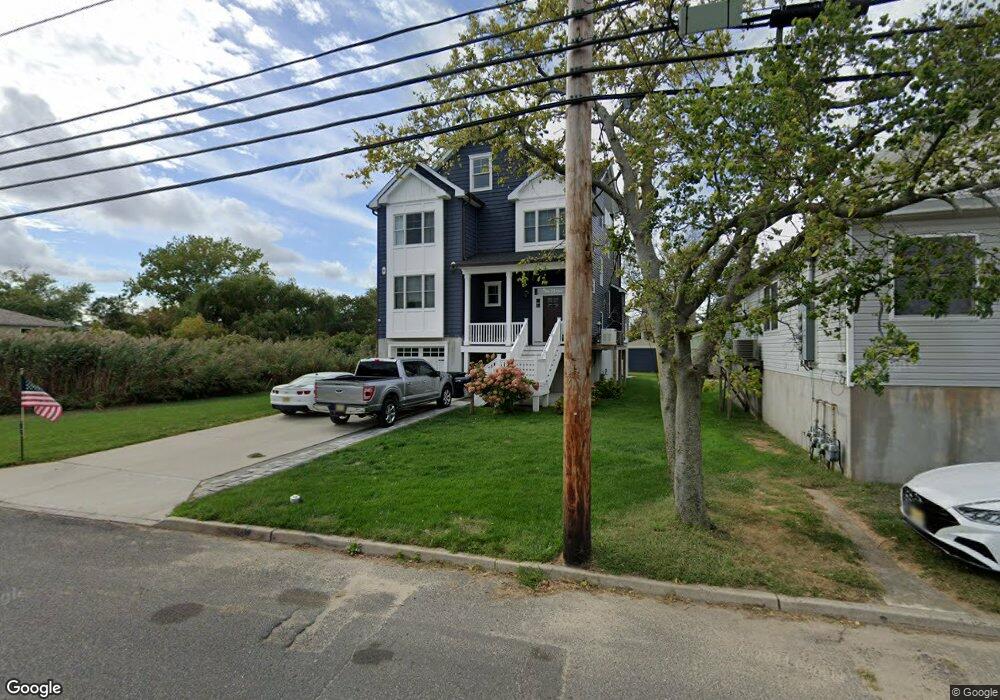
22 Main St Port Monmouth, NJ 07758
Estimated Value: $700,000 - $1,091,000
3
Beds
1
Bath
3,315
Sq Ft
$283/Sq Ft
Est. Value
About This Home
This home is located at 22 Main St, Port Monmouth, NJ 07758 and is currently estimated at $936,942, approximately $282 per square foot. 22 Main St is a home located in Monmouth County with nearby schools including Port Monmouth Elementary School, Thorne Middle School, and Middletown High School North.
Ownership History
Date
Name
Owned For
Owner Type
Purchase Details
Closed on
Oct 19, 2018
Sold by
Flangan James B
Bought by
Apel Warren C
Current Estimated Value
Purchase Details
Closed on
Jun 24, 2004
Sold by
Santomauro Maria
Bought by
Deluca Vincent
Home Financials for this Owner
Home Financials are based on the most recent Mortgage that was taken out on this home.
Original Mortgage
$181,450
Interest Rate
6.32%
Mortgage Type
Purchase Money Mortgage
Purchase Details
Closed on
May 13, 2002
Sold by
Ryan Timothy
Bought by
Santomauro Maria
Home Financials for this Owner
Home Financials are based on the most recent Mortgage that was taken out on this home.
Original Mortgage
$128,803
Interest Rate
7.01%
Mortgage Type
FHA
Purchase Details
Closed on
Nov 30, 2000
Sold by
Semchessen Kim
Bought by
Ryan Timothy
Home Financials for this Owner
Home Financials are based on the most recent Mortgage that was taken out on this home.
Original Mortgage
$97,600
Interest Rate
7.64%
Mortgage Type
FHA
Create a Home Valuation Report for This Property
The Home Valuation Report is an in-depth analysis detailing your home's value as well as a comparison with similar homes in the area
Home Values in the Area
Average Home Value in this Area
Purchase History
| Date | Buyer | Sale Price | Title Company |
|---|---|---|---|
| Apel Warren C | $58,000 | None Available | |
| Deluca Vincent | $191,000 | -- | |
| Santomauro Maria | $130,900 | -- | |
| Ryan Timothy | $98,500 | -- |
Source: Public Records
Mortgage History
| Date | Status | Borrower | Loan Amount |
|---|---|---|---|
| Previous Owner | Deluca Vincent | $181,450 | |
| Previous Owner | Santomauro Maria | $128,803 | |
| Previous Owner | Ryan Timothy | $97,600 |
Source: Public Records
Tax History Compared to Growth
Tax History
| Year | Tax Paid | Tax Assessment Tax Assessment Total Assessment is a certain percentage of the fair market value that is determined by local assessors to be the total taxable value of land and additions on the property. | Land | Improvement |
|---|---|---|---|---|
| 2025 | $13,897 | $904,500 | $265,700 | $638,800 |
| 2024 | $12,272 | $844,800 | $210,800 | $634,000 |
| 2023 | $12,272 | $706,100 | $186,100 | $520,000 |
| 2022 | $11,999 | $639,200 | $144,100 | $495,100 |
| 2021 | $11,999 | $580,500 | $116,300 | $464,200 |
| 2020 | $2,311 | $108,100 | $108,100 | $0 |
| 2019 | $2,621 | $124,100 | $108,100 | $16,000 |
| 2018 | $2,652 | $122,400 | $108,100 | $14,300 |
| 2017 | $2,130 | $97,300 | $80,300 | $17,000 |
| 2016 | $2,487 | $116,700 | $80,300 | $36,400 |
| 2015 | $2,571 | $116,500 | $80,300 | $36,200 |
| 2014 | $3,247 | $143,500 | $107,300 | $36,200 |
Source: Public Records
Map
Nearby Homes
- 620 Park Ave
- 19 Brainard Ave
- 11 Brainard Ave
- 36 Main St
- 602 Park Ave Unit 7C
- 62 Brainard Ave
- 37 Golden Eye Ln
- 36 Golden Eye Ln
- 78 Wilson Ave
- 2 Lydia Place
- 43 Skimmer Ln
- 79 Compton St Unit A & B
- 147 Church St
- 92 Compton St
- 19 Walada Ave
- 617 Carter Ave
- 35 Willow St
- 443 Port Monmouth Rd E
- 0 Clinton St Unit 22238196
- 0 S End Ave Unit 22420779