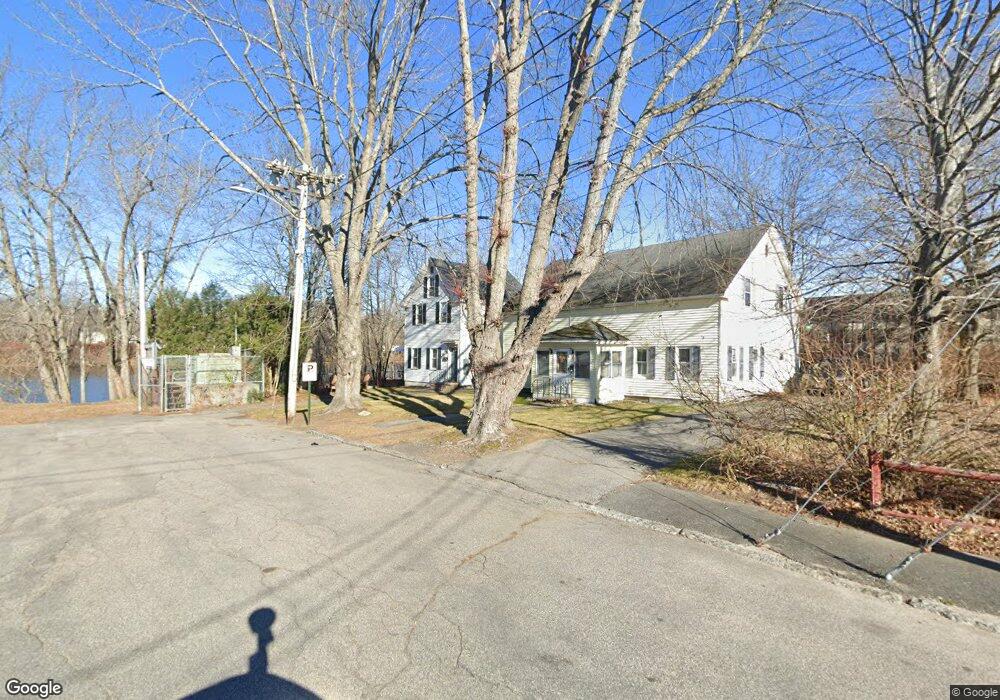
22 Maple St Biddeford, ME 04005
Downtown Biddeford NeighborhoodEstimated Value: $365,000 - $443,000
4
Beds
2
Baths
1,362
Sq Ft
$304/Sq Ft
Est. Value
About This Home
This home is located at 22 Maple St, Biddeford, ME 04005 and is currently estimated at $413,901, approximately $303 per square foot. 22 Maple St is a home located in York County with nearby schools including John F Kennedy Memorial School, Biddeford Primary School, and Biddeford Intermediate School.
Ownership History
Date
Name
Owned For
Owner Type
Purchase Details
Closed on
Dec 10, 2021
Sold by
New Dam Llc
Bought by
Spring Is Apartments Llc
Current Estimated Value
Home Financials for this Owner
Home Financials are based on the most recent Mortgage that was taken out on this home.
Original Mortgage
$532,500
Outstanding Balance
$484,913
Interest Rate
3.14%
Mortgage Type
Purchase Money Mortgage
Estimated Equity
-$71,012
Purchase Details
Closed on
Oct 1, 2015
Sold by
Nelson Timothy J and Davis Colleen
Bought by
New Dam Llc
Purchase Details
Closed on
Mar 4, 2014
Sold by
Cote Ricky D
Bought by
Ready Craig A
Purchase Details
Closed on
Dec 24, 2009
Sold by
Nelson Muriel
Bought by
Nelson Timothy J and Davis Colleen
Home Financials for this Owner
Home Financials are based on the most recent Mortgage that was taken out on this home.
Original Mortgage
$40,000
Interest Rate
4.92%
Mortgage Type
Unknown
Create a Home Valuation Report for This Property
The Home Valuation Report is an in-depth analysis detailing your home's value as well as a comparison with similar homes in the area
Home Values in the Area
Average Home Value in this Area
Purchase History
| Date | Buyer | Sale Price | Title Company |
|---|---|---|---|
| Spring Is Apartments Llc | -- | None Available | |
| New Dam Llc | -- | -- | |
| Ready Craig A | -- | -- | |
| Nelson Timothy J | -- | -- |
Source: Public Records
Mortgage History
| Date | Status | Borrower | Loan Amount |
|---|---|---|---|
| Open | Spring Is Apartments Llc | $532,500 | |
| Previous Owner | Nelson Timothy J | $40,000 |
Source: Public Records
Tax History
| Year | Tax Paid | Tax Assessment Tax Assessment Total Assessment is a certain percentage of the fair market value that is determined by local assessors to be the total taxable value of land and additions on the property. | Land | Improvement |
|---|---|---|---|---|
| 2025 | $4,309 | $288,400 | $145,000 | $143,400 |
| 2024 | $4,061 | $285,600 | $145,000 | $140,600 |
| 2023 | $3,706 | $282,500 | $141,900 | $140,600 |
| 2022 | $3,522 | $214,600 | $95,100 | $119,500 |
| 2021 | $3,263 | $179,000 | $77,000 | $102,000 |
| 2020 | $3,222 | $160,700 | $67,900 | $92,800 |
| 2019 | $3,211 | $160,700 | $67,900 | $92,800 |
| 2018 | $3,166 | $160,700 | $67,900 | $92,800 |
| 2017 | $3,081 | $153,500 | $67,900 | $85,600 |
| 2016 | $3,049 | $153,500 | $67,900 | $85,600 |
| 2015 | $2,989 | $153,500 | $67,900 | $85,600 |
| 2014 | $2,915 | $153,500 | $67,900 | $85,600 |
| 2013 | -- | $161,700 | $83,100 | $78,600 |
Source: Public Records
Map
Nearby Homes
- 20 Upper Falls Rd Unit 506
- 20 Upper Falls Rd Unit 403
- 20 Upper Falls Rd Unit 406
- 20 Upper Falls Rd Unit 503
- 20 Upper Falls Rd Unit 501
- 674 South St
- 26 Upper Falls Rd Unit 108
- 26 Upper Falls Rd Unit 107
- 120 Lincoln St
- 57 Hill St
- 24 Dyer St
- 242 Lincoln St
- 1 Saco Island Unit 111
- 2 Main St Unit 15-311
- 2 Main St Unit 17-407
- 2 Main St Unit 15-502
- 2 Main St Unit 18-415
- 2 Main St Unit 18-501
- 2 Main St Unit 15-511
- 2 Main St Unit 17-416
Your Personal Tour Guide
Ask me questions while you tour the home.