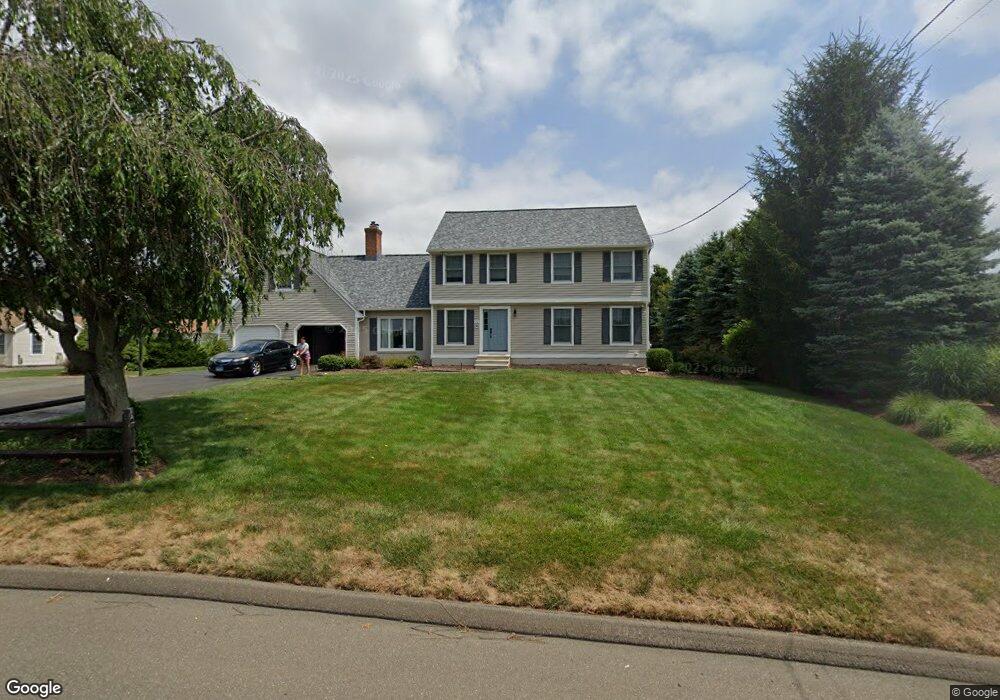
22 Mapleview Rd Wallingford, CT 06492
Estimated Value: $692,949 - $739,000
4
Beds
3
Baths
2,490
Sq Ft
$290/Sq Ft
Est. Value
About This Home
This home is located at 22 Mapleview Rd, Wallingford, CT 06492 and is currently estimated at $723,237, approximately $290 per square foot. 22 Mapleview Rd is a home located in New Haven County with nearby schools including Moses Y Beach Elementary School, Rock Hill Elementary School, and Dag Hammarskjold Middle School.
Ownership History
Date
Name
Owned For
Owner Type
Purchase Details
Closed on
Nov 12, 2024
Sold by
Nicefaro David G and Nicefaro Natalia P
Bought by
Nicefaro David G and Nicefaro Natalia P
Current Estimated Value
Purchase Details
Closed on
Jul 12, 1999
Sold by
Romig Charles A and Romig Judith M
Bought by
Nicefaro David G and Nicefaro Natalia P
Home Financials for this Owner
Home Financials are based on the most recent Mortgage that was taken out on this home.
Original Mortgage
$212,800
Interest Rate
7.19%
Purchase Details
Closed on
Jun 12, 1989
Sold by
Poline Stephen M
Bought by
Romig Charles A
Create a Home Valuation Report for This Property
The Home Valuation Report is an in-depth analysis detailing your home's value as well as a comparison with similar homes in the area
Home Values in the Area
Average Home Value in this Area
Purchase History
| Date | Buyer | Sale Price | Title Company |
|---|---|---|---|
| Nicefaro David G | -- | None Available | |
| Nicefaro David G | -- | None Available | |
| Nicefaro David G | $266,000 | -- | |
| Nicefaro David G | $266,000 | -- | |
| Romig Charles A | $285,000 | -- |
Source: Public Records
Mortgage History
| Date | Status | Borrower | Loan Amount |
|---|---|---|---|
| Previous Owner | Romig Charles A | $203,000 | |
| Previous Owner | Romig Charles A | $212,000 | |
| Previous Owner | Romig Charles A | $212,000 | |
| Previous Owner | Romig Charles A | $212,800 |
Source: Public Records
Tax History
| Year | Tax Paid | Tax Assessment Tax Assessment Total Assessment is a certain percentage of the fair market value that is determined by local assessors to be the total taxable value of land and additions on the property. | Land | Improvement |
|---|---|---|---|---|
| 2025 | $10,601 | $439,500 | $121,200 | $318,300 |
| 2024 | $9,305 | $303,500 | $101,000 | $202,500 |
| 2023 | $8,905 | $303,500 | $101,000 | $202,500 |
| 2022 | $8,814 | $303,500 | $101,000 | $202,500 |
| 2021 | $8,656 | $303,500 | $101,000 | $202,500 |
| 2020 | $8,340 | $285,700 | $98,000 | $187,700 |
| 2019 | $8,340 | $285,700 | $98,000 | $187,700 |
| 2018 | $8,182 | $285,700 | $98,000 | $187,700 |
| 2017 | $8,157 | $285,700 | $98,000 | $187,700 |
| 2016 | $7,968 | $285,700 | $98,000 | $187,700 |
| 2015 | $7,909 | $287,900 | $98,000 | $189,900 |
| 2014 | $7,742 | $287,900 | $98,000 | $189,900 |
Source: Public Records
Map
Nearby Homes
- 101 Grieb Rd
- 1 Dean Dr
- 5 Kish Place
- 5 Mae Ln
- 1039 Durham Rd
- 570 N Main St
- 71 Cedar Ln
- 46 Walnut Ln
- 85 N Colony St
- 380 Main St Unit 3
- 380 Main St Unit 7
- 380 Main St Unit 4
- 380 Main St Unit 16
- 380 Main St Unit 13
- 380 Main St Unit 14
- 230 Main St Unit 63
- 230 Main St Unit 18
- 396 Main St Unit 2
- 70 N Turnpike Rd Unit 21
- 42 S Cherry St Unit 238
- 24 Mapleview Rd
- 20 Mapleview Rd
- 9 Rolling Meadow Dr
- 11 Rolling Meadow Dr
- 2 Taylor Ln
- 7 Rolling Meadow Dr
- 19 Mapleview Rd
- 5 Rolling Meadow Dr
- 4 Taylor Ln
- 15 Rolling Meadow Dr
- 10 Rolling Meadow Dr
- 379 E Main St
- 381 E Main St
- 8 Rolling Meadow Dr
- 3 Rolling Meadow Dr
- 6 Taylor Ln
- 7 Mapleview Rd
- 12 Rolling Meadow Dr
- 6 Rolling Meadow Dr
- 17 Rolling Meadow Dr
Your Personal Tour Guide
Ask me questions while you tour the home.