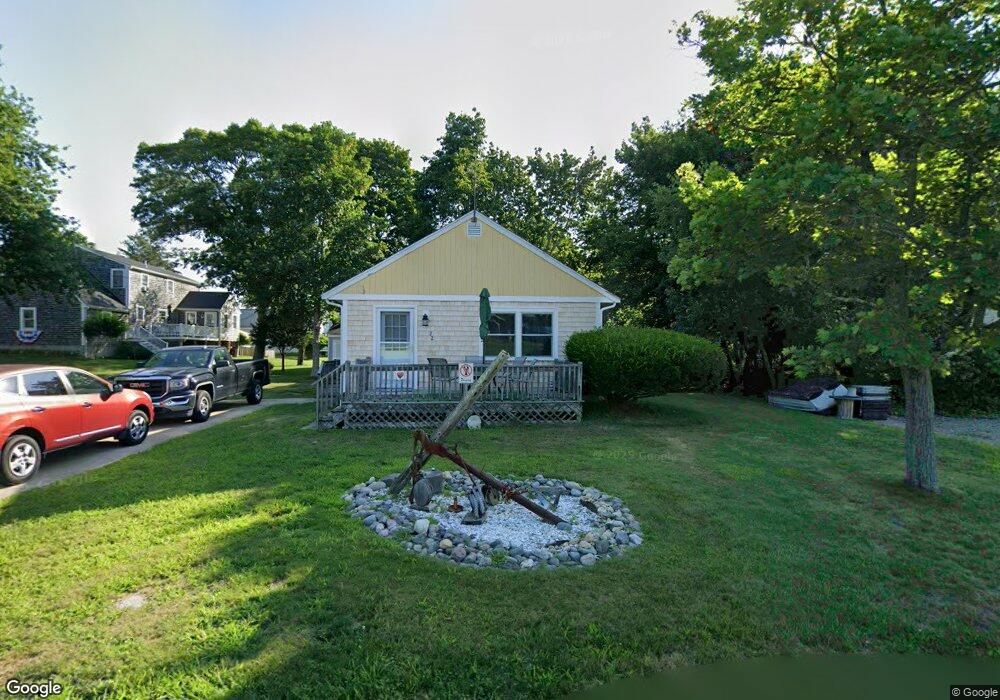
22 Marshall Ave Marshfield, MA 02050
Ocean Bluff-Brant Rock NeighborhoodEstimated Value: $459,611 - $972,000
1
Bed
1
Bath
672
Sq Ft
$888/Sq Ft
Est. Value
About This Home
This home is located at 22 Marshall Ave, Marshfield, MA 02050 and is currently estimated at $596,653, approximately $887 per square foot. 22 Marshall Ave is a home with nearby schools including Governor Edward Winslow School, Furnace Brook Middle School, and Marshfield High School.
Ownership History
Date
Name
Owned For
Owner Type
Purchase Details
Closed on
May 9, 2003
Sold by
Mannix Andrew
Bought by
Mannix Andrew and Mannix Laurie A
Current Estimated Value
Purchase Details
Closed on
May 27, 1988
Sold by
Woodman Frank W
Bought by
Mannix Andrew
Create a Home Valuation Report for This Property
The Home Valuation Report is an in-depth analysis detailing your home's value as well as a comparison with similar homes in the area
Home Values in the Area
Average Home Value in this Area
Purchase History
| Date | Buyer | Sale Price | Title Company |
|---|---|---|---|
| Mannix Andrew | -- | -- | |
| Mannix Andrew | -- | -- | |
| Mannix Andrew | $115,000 | -- |
Source: Public Records
Mortgage History
| Date | Status | Borrower | Loan Amount |
|---|---|---|---|
| Open | Mannix Andrew | $117,000 | |
| Previous Owner | Mannix Andrew | $112,000 | |
| Previous Owner | Mannix Andrew | $100,000 |
Source: Public Records
Tax History
| Year | Tax Paid | Tax Assessment Tax Assessment Total Assessment is a certain percentage of the fair market value that is determined by local assessors to be the total taxable value of land and additions on the property. | Land | Improvement |
|---|---|---|---|---|
| 2025 | $4,097 | $413,800 | $321,600 | $92,200 |
| 2024 | $4,049 | $389,700 | $301,500 | $88,200 |
| 2023 | $3,850 | $343,900 | $271,400 | $72,500 |
| 2022 | $3,850 | $297,300 | $231,200 | $66,100 |
| 2021 | $3,702 | $280,700 | $221,100 | $59,600 |
| 2020 | $3,298 | $247,400 | $191,000 | $56,400 |
| 2019 | $3,267 | $244,200 | $191,000 | $53,200 |
| 2018 | $3,265 | $244,200 | $191,000 | $53,200 |
| 2017 | $3,079 | $224,400 | $180,900 | $43,500 |
| 2016 | $2,976 | $214,400 | $170,900 | $43,500 |
| 2015 | $2,940 | $221,200 | $170,900 | $50,300 |
| 2014 | $2,968 | $223,300 | $170,900 | $52,400 |
Source: Public Records
Map
Nearby Homes
- 78 Tower Ave
- 122 June St
- 17 Dyke Rd
- 116 Island St
- 106 Careswell St
- 32 Gratto Rd
- 71 Gurnet Rd
- 85 Constitution Rd
- 116 Outlook Rd
- 30 Chandler Dr
- 42 Carr Rd
- 86 Barouche Dr
- 155 Quincy Ave
- 7 Pierce Rd
- 92 Salt Meadow Waye
- 184 King Phillips Pathe
- 242 Enterprise St
- 290 S River St
- 431 Moraine St
- 236 Powder Point Ave
- 125 Franklin St
- 119 Franklin St
- 134 Franklin St
- 135 Franklin St
- 130 Franklin St
- 115 Franklin St
- 126 Franklin St
- 122 Franklin St
- 113 Franklin St
- 98 Dyke Rd
- 98 Dyke Rd Unit 98
- 44 Marshall Ave
- 44 Marshall Ave
- 109 Franklin St
- 33 Tower Ave
- 96 Dyke Rd
- 39 Tower Ave
- 46 Marshall Ave
- 43 Tower Ave
- 105 Franklin St
Your Personal Tour Guide
Ask me questions while you tour the home.