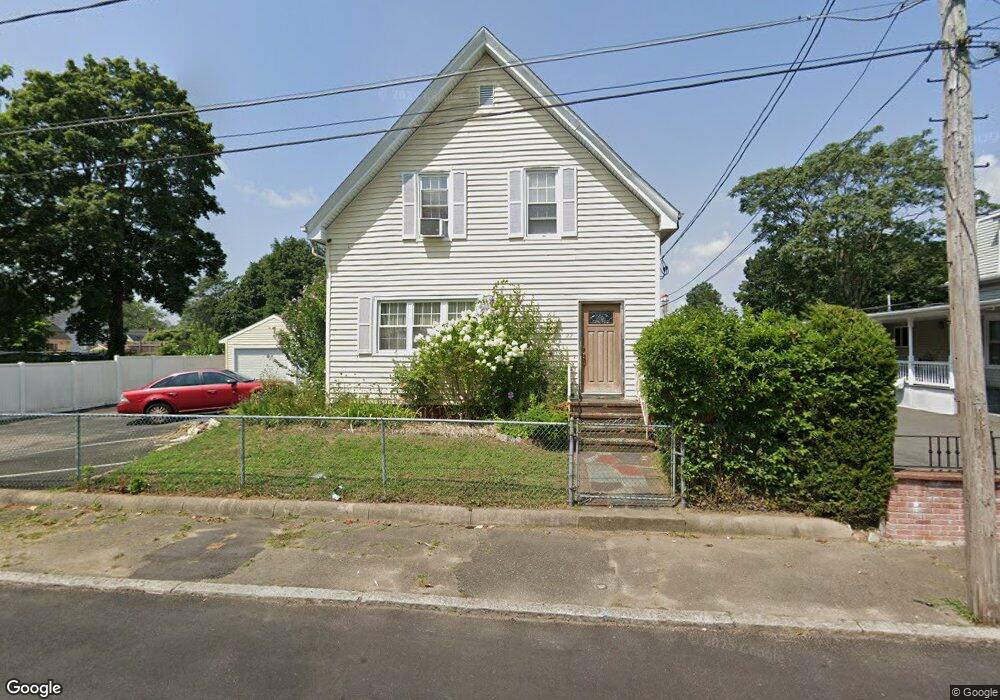
22 Mason St Brockton, MA 02302
Estimated Value: $444,000 - $583,999
4
Beds
2
Baths
2,435
Sq Ft
$210/Sq Ft
Est. Value
About This Home
This home is located at 22 Mason St, Brockton, MA 02302 and is currently estimated at $512,000, approximately $210 per square foot. 22 Mason St is a home located in Plymouth County with nearby schools including Arnone Elementary School, Joseph F. Plouffe Middle School, and Trinity Catholic Academy.
Ownership History
Date
Name
Owned For
Owner Type
Purchase Details
Closed on
Jun 3, 2005
Sold by
Dos Santos Jaoquim C and Dos Santos Matilde F
Bought by
Carvalho Jorge M
Current Estimated Value
Purchase Details
Closed on
Oct 5, 1994
Sold by
Fhlmc
Bought by
Raposo John C and Raposo Rosemary
Purchase Details
Closed on
Jan 31, 1994
Sold by
Gittens Michael A and Gittens Deborah A
Bought by
Fhlmc
Purchase Details
Closed on
Jul 14, 1988
Sold by
Johnson Kim E
Bought by
Johnson Raymond C
Create a Home Valuation Report for This Property
The Home Valuation Report is an in-depth analysis detailing your home's value as well as a comparison with similar homes in the area
Home Values in the Area
Average Home Value in this Area
Purchase History
| Date | Buyer | Sale Price | Title Company |
|---|---|---|---|
| Carvalho Jorge M | $270,000 | -- | |
| Raposo John C | $64,000 | -- | |
| Fhlmc | $84,000 | -- | |
| Johnson Raymond C | $4,000 | -- |
Source: Public Records
Mortgage History
| Date | Status | Borrower | Loan Amount |
|---|---|---|---|
| Open | Johnson Raymond C | $17,000 | |
| Open | Johnson Raymond C | $256,800 |
Source: Public Records
Tax History Compared to Growth
Tax History
| Year | Tax Paid | Tax Assessment Tax Assessment Total Assessment is a certain percentage of the fair market value that is determined by local assessors to be the total taxable value of land and additions on the property. | Land | Improvement |
|---|---|---|---|---|
| 2025 | $5,733 | $473,400 | $140,100 | $333,300 |
| 2024 | $5,496 | $457,200 | $140,100 | $317,100 |
| 2023 | $5,006 | $385,700 | $104,300 | $281,400 |
| 2022 | $5,256 | $376,200 | $94,800 | $281,400 |
| 2021 | $4,801 | $331,100 | $78,700 | $252,400 |
| 2020 | $4,459 | $294,300 | $73,700 | $220,600 |
| 2019 | $4,434 | $285,300 | $71,900 | $213,400 |
| 2018 | $4,290 | $267,100 | $71,900 | $195,200 |
| 2017 | $4,022 | $249,800 | $71,900 | $177,900 |
| 2016 | $3,753 | $216,200 | $69,700 | $146,500 |
| 2015 | -- | $177,900 | $69,700 | $108,200 |
| 2014 | $3,343 | $184,400 | $69,700 | $114,700 |
Source: Public Records
Map
Nearby Homes