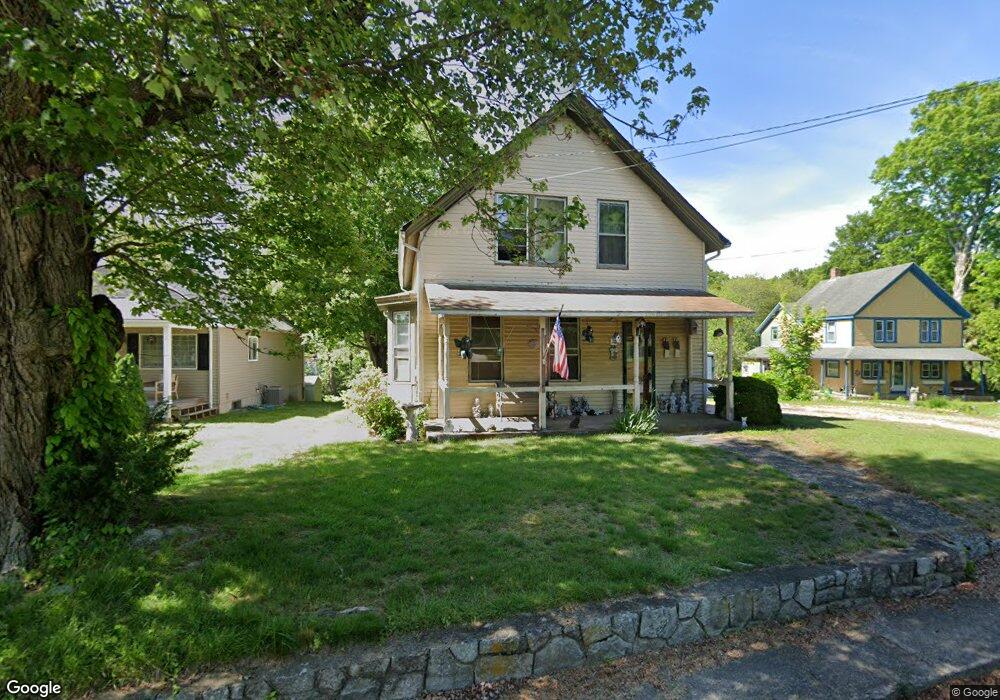
22 Maxson St Ashaway, RI 02804
Ashley-Bradford NeighborhoodEstimated Value: $367,000 - $431,000
2
Beds
1
Bath
1,030
Sq Ft
$377/Sq Ft
Est. Value
About This Home
This home is located at 22 Maxson St, Ashaway, RI 02804 and is currently estimated at $387,971, approximately $376 per square foot. 22 Maxson St is a home located in Washington County with nearby schools including Chariho Regional Middle School, Chariho High School, and St. Michael School.
Ownership History
Date
Name
Owned For
Owner Type
Purchase Details
Closed on
Oct 25, 1999
Sold by
Emc Mtg Corp
Bought by
Marler Sandra A
Current Estimated Value
Purchase Details
Closed on
Oct 1, 1998
Sold by
Crandall Mickey A
Bought by
Emc Mtg Corp
Create a Home Valuation Report for This Property
The Home Valuation Report is an in-depth analysis detailing your home's value as well as a comparison with similar homes in the area
Home Values in the Area
Average Home Value in this Area
Purchase History
| Date | Buyer | Sale Price | Title Company |
|---|---|---|---|
| Marler Sandra A | $75,000 | -- | |
| Emc Mtg Corp | $77,150 | -- |
Source: Public Records
Mortgage History
| Date | Status | Borrower | Loan Amount |
|---|---|---|---|
| Open | Emc Mtg Corp | $149,200 | |
| Closed | Emc Mtg Corp | $18,000 | |
| Closed | Emc Mtg Corp | $119,082 |
Source: Public Records
Tax History
| Year | Tax Paid | Tax Assessment Tax Assessment Total Assessment is a certain percentage of the fair market value that is determined by local assessors to be the total taxable value of land and additions on the property. | Land | Improvement |
|---|---|---|---|---|
| 2025 | $3,972 | $259,800 | $125,800 | $134,000 |
| 2024 | $3,913 | $259,800 | $125,800 | $134,000 |
| 2023 | $3,809 | $259,800 | $125,800 | $134,000 |
| 2022 | $3,276 | $176,800 | $75,500 | $101,300 |
| 2021 | $3,276 | $176,800 | $75,500 | $101,300 |
| 2020 | $3,232 | $176,800 | $75,500 | $101,300 |
| 2019 | $2,901 | $140,300 | $62,300 | $78,000 |
| 2018 | $2,816 | $140,300 | $62,300 | $78,000 |
| 2017 | $2,816 | $140,300 | $62,300 | $78,000 |
| 2016 | $2,613 | $126,600 | $56,400 | $70,200 |
| 2015 | $2,580 | $126,600 | $56,400 | $70,200 |
| 2014 | $2,613 | $126,600 | $56,400 | $70,200 |
| 2013 | $2,754 | $139,300 | $54,400 | $84,900 |
Source: Public Records
Map
Nearby Homes
Your Personal Tour Guide
Ask me questions while you tour the home.