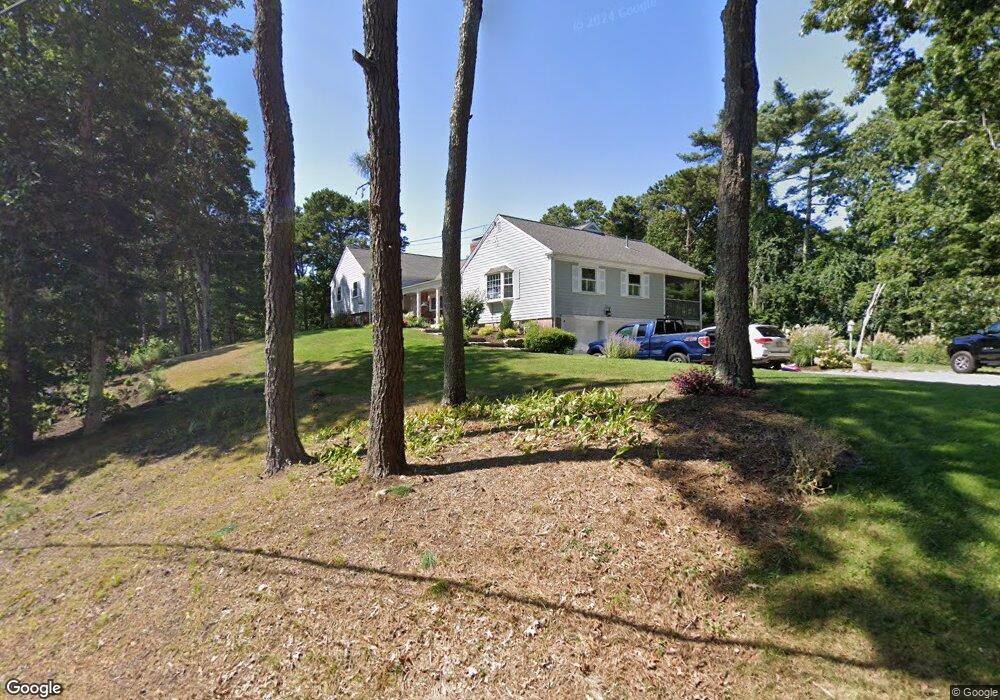
22 Merchant Ave Unit 2 Yarmouth Port, MA 02675
Yarmouth Port NeighborhoodEstimated Value: $939,628 - $1,100,000
5
Beds
4
Baths
3,350
Sq Ft
$305/Sq Ft
Est. Value
About This Home
This home is located at 22 Merchant Ave Unit 2, Yarmouth Port, MA 02675 and is currently estimated at $1,022,657, approximately $305 per square foot. 22 Merchant Ave Unit 2 is a home located in Barnstable County with nearby schools including Dennis-Yarmouth Regional High School and St. Pius X. School.
Ownership History
Date
Name
Owned For
Owner Type
Purchase Details
Closed on
Dec 28, 2017
Sold by
Nationstar Mortgage Ll
Bought by
Dillon Joseph
Current Estimated Value
Purchase Details
Closed on
Dec 15, 2015
Sold by
Martha Olson Rt
Bought by
Dillon Joseph P and Dillon Paula J
Home Financials for this Owner
Home Financials are based on the most recent Mortgage that was taken out on this home.
Original Mortgage
$205,000
Interest Rate
3.77%
Mortgage Type
New Conventional
Purchase Details
Closed on
Dec 18, 2008
Sold by
Olson Martha C
Bought by
Olson Gary F and Olson Martha C
Create a Home Valuation Report for This Property
The Home Valuation Report is an in-depth analysis detailing your home's value as well as a comparison with similar homes in the area
Home Values in the Area
Average Home Value in this Area
Purchase History
| Date | Buyer | Sale Price | Title Company |
|---|---|---|---|
| Dillon Joseph | $265,000 | -- | |
| Dillon Joseph P | $415,000 | -- | |
| Olson Gary F | -- | -- |
Source: Public Records
Mortgage History
| Date | Status | Borrower | Loan Amount |
|---|---|---|---|
| Previous Owner | Dillon Joseph P | $205,000 |
Source: Public Records
Tax History Compared to Growth
Tax History
| Year | Tax Paid | Tax Assessment Tax Assessment Total Assessment is a certain percentage of the fair market value that is determined by local assessors to be the total taxable value of land and additions on the property. | Land | Improvement |
|---|---|---|---|---|
| 2025 | $6,194 | $874,800 | $342,500 | $532,300 |
| 2024 | $6,029 | $816,900 | $327,700 | $489,200 |
| 2023 | $5,927 | $730,800 | $298,100 | $432,700 |
| 2022 | $5,354 | $583,200 | $238,300 | $344,900 |
| 2021 | $5,249 | $549,100 | $256,400 | $292,700 |
| 2020 | $5,210 | $535,500 | $274,200 | $261,300 |
| 2019 | $4,889 | $484,100 | $274,200 | $209,900 |
| 2018 | $4,856 | $471,900 | $262,000 | $209,900 |
| 2017 | $4,728 | $471,900 | $262,000 | $209,900 |
| 2016 | $5,793 | $580,500 | $262,000 | $318,500 |
| 2015 | $5,646 | $562,400 | $262,000 | $300,400 |
Source: Public Records
Map
Nearby Homes
- 22 Merchant Ave
- 8 Merchant Ave
- 15 Merchant Ave
- 164 Merchant Ave
- 314 N Dennis Rd
- 158 Merchant Ave
- 36 Merchant Ave
- 150 Merchant Ave
- 46 Merchant Ave
- 334 N Dennis Rd
- 35 Merchant Ave
- 56 Merchant Ave
- 139 Merchant Ave
- 27 Merchant Ave
- 24 Merchant Ave
- 0 Merchant Ave
- 150 Merchant Ave
- 144 Merchant Ave
- 292 N Dennis Rd
- 56 N Merchant