Estimated Value: $853,527 - $922,000
4
Beds
3
Baths
2,124
Sq Ft
$420/Sq Ft
Est. Value
About This Home
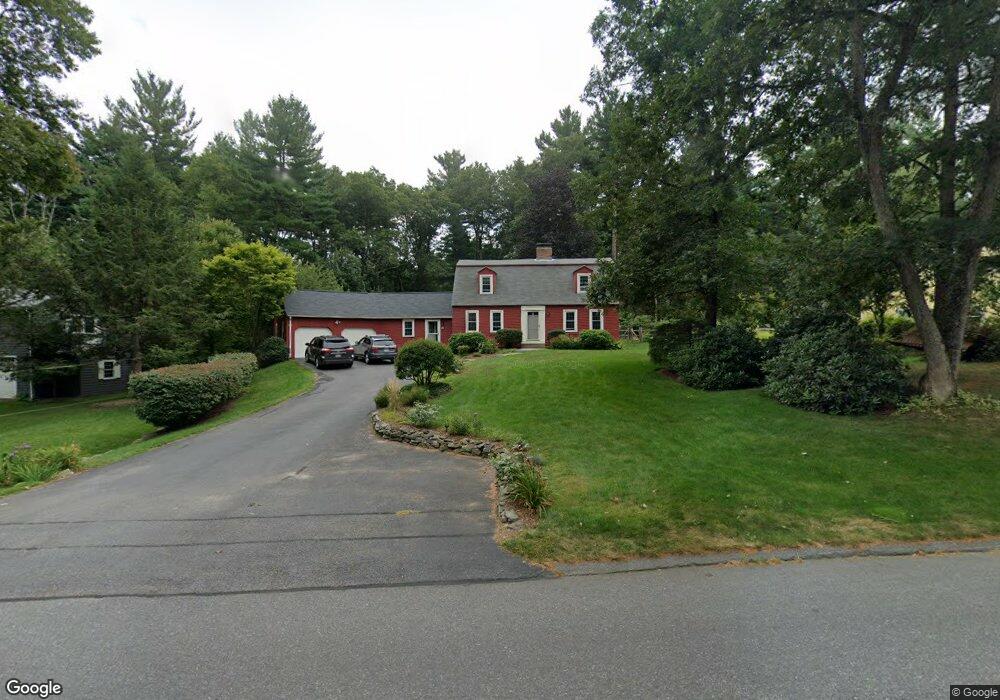
This home is located at 22 Minot Ave, Acton, MA 01720 and is currently estimated at $892,382, approximately $420 per square foot. 22 Minot Ave is a home located in Middlesex County with nearby schools including Acton-Boxborough Regional High School and Concord Academy.
Ownership History
Date
Name
Owned For
Owner Type
Purchase Details
Closed on
Mar 28, 2006
Sold by
Mertzlufft Christine E and Mertzlufft Paul T
Bought by
Moore-Nelson Jennifer and Nelson Noah A
Current Estimated Value
Purchase Details
Closed on
Nov 21, 2001
Sold by
White John B and Regan Mary Beth
Bought by
Mertzlufft Paul T and Mertzlufft Christine E
Purchase Details
Closed on
Aug 1, 1988
Sold by
Williamson Robert J
Bought by
White John B
Create a Home Valuation Report for This Property
The Home Valuation Report is an in-depth analysis detailing your home's value as well as a comparison with similar homes in the area
Home Values in the Area
Average Home Value in this Area
Purchase History
| Date | Buyer | Sale Price | Title Company |
|---|---|---|---|
| Moore-Nelson Jennifer | $560,000 | -- | |
| Mertzlufft Paul T | $442,500 | -- | |
| White John B | $270,000 | -- |
Source: Public Records
Mortgage History
| Date | Status | Borrower | Loan Amount |
|---|---|---|---|
| Open | White John B | $411,700 | |
| Closed | White John B | $413,700 | |
| Closed | White John B | $417,000 |
Source: Public Records
Tax History
| Year | Tax Paid | Tax Assessment Tax Assessment Total Assessment is a certain percentage of the fair market value that is determined by local assessors to be the total taxable value of land and additions on the property. | Land | Improvement |
|---|---|---|---|---|
| 2025 | $13,476 | $785,800 | $319,900 | $465,900 |
| 2024 | $12,606 | $756,200 | $319,900 | $436,300 |
| 2023 | $12,292 | $700,000 | $290,900 | $409,100 |
| 2022 | $11,635 | $598,200 | $252,800 | $345,400 |
| 2021 | $11,351 | $561,100 | $233,900 | $327,200 |
| 2020 | $10,709 | $556,600 | $233,900 | $322,700 |
| 2019 | $10,427 | $538,300 | $233,900 | $304,400 |
| 2018 | $10,246 | $528,700 | $233,900 | $294,800 |
| 2017 | $9,987 | $524,000 | $233,900 | $290,100 |
| 2016 | $9,802 | $509,700 | $233,900 | $275,800 |
| 2015 | $9,618 | $504,900 | $233,900 | $271,000 |
| 2014 | $9,445 | $485,600 | $233,900 | $251,700 |
Source: Public Records
Map
Nearby Homes
Your Personal Tour Guide
Ask me questions while you tour the home.