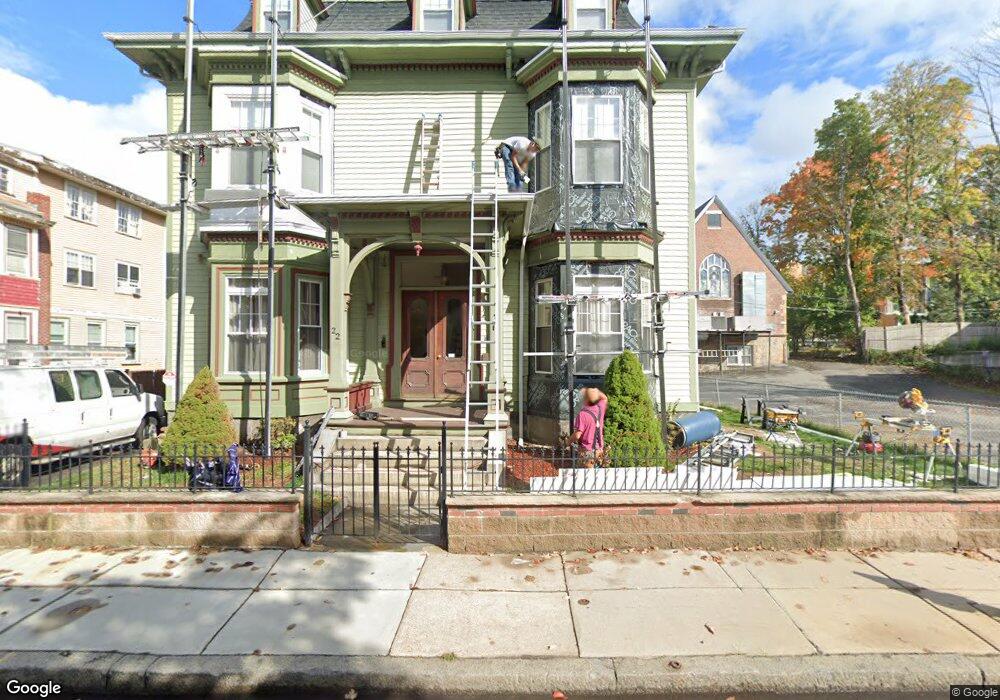
22 Moreland St Unit 2 Roxbury, MA 02119
Sav-Mor NeighborhoodEstimated Value: $651,000 - $783,000
3
Beds
2
Baths
1,755
Sq Ft
$398/Sq Ft
Est. Value
About This Home
This home is located at 22 Moreland St Unit 2, Roxbury, MA 02119 and is currently estimated at $699,355, approximately $398 per square foot. 22 Moreland St Unit 2 is a home located in Suffolk County with nearby schools including Dudley Street Neighborhood Charter School and City on a Hill Charter Public School.
Ownership History
Date
Name
Owned For
Owner Type
Purchase Details
Closed on
Mar 10, 2010
Sold by
Williams Glenroy O
Bought by
Nicholls Barton and Nicholls Carol
Current Estimated Value
Home Financials for this Owner
Home Financials are based on the most recent Mortgage that was taken out on this home.
Original Mortgage
$274,928
Outstanding Balance
$186,887
Interest Rate
5.5%
Mortgage Type
FHA
Estimated Equity
$512,468
Create a Home Valuation Report for This Property
The Home Valuation Report is an in-depth analysis detailing your home's value as well as a comparison with similar homes in the area
Home Values in the Area
Average Home Value in this Area
Purchase History
| Date | Buyer | Sale Price | Title Company |
|---|---|---|---|
| Nicholls Barton | $280,000 | -- | |
| Nicholls Barton | $280,000 | -- |
Source: Public Records
Mortgage History
| Date | Status | Borrower | Loan Amount |
|---|---|---|---|
| Open | Nicholls Barton | $274,928 | |
| Closed | Nicholls Barton | $274,928 |
Source: Public Records
Tax History Compared to Growth
Tax History
| Year | Tax Paid | Tax Assessment Tax Assessment Total Assessment is a certain percentage of the fair market value that is determined by local assessors to be the total taxable value of land and additions on the property. | Land | Improvement |
|---|---|---|---|---|
| 2025 | $7,476 | $645,600 | $0 | $645,600 |
| 2024 | $6,396 | $586,800 | $0 | $586,800 |
| 2023 | $6,060 | $564,200 | $0 | $564,200 |
| 2022 | $5,846 | $537,300 | $0 | $537,300 |
| 2021 | $5,621 | $526,800 | $0 | $526,800 |
| 2020 | $5,450 | $516,100 | $0 | $516,100 |
| 2019 | $4,945 | $469,200 | $0 | $469,200 |
| 2018 | $4,469 | $426,400 | $0 | $426,400 |
| 2017 | $4,220 | $398,500 | $0 | $398,500 |
| 2016 | $4,096 | $372,400 | $0 | $372,400 |
| 2015 | $3,325 | $274,600 | $0 | $274,600 |
| 2014 | $3,020 | $240,100 | $0 | $240,100 |
Source: Public Records
Map
Nearby Homes
- 20 Rockville Park
- 22 Rockville Park
- 37 Regent St Unit 2
- 51 Saint James St
- 91 Zeigler St
- 250 Dudley St Unit 1
- 2 Mount Pleasant Place Unit 2
- 101 Mount Pleasant Ave
- 10 Taber St Unit 501
- 30 Copeland St Unit 1
- 33 Copeland Park Unit C
- 108 Mount Pleasant Ave Unit 108R
- 10 Rockland St Unit 4
- 7 Langford Park Unit 3
- 38 Juniper St
- 59 Perrin St
- 59 Perrin St Unit 1
- 94 Walnut Ave
- 9 W Cedar St Unit 1
- 2149 Washington St Unit 604
- 22 Moreland St Unit 3
- 22 Moreland St Unit 1
- 22 Moreland St
- 18 Moreland St Unit 20
- 18 Moreland St Unit 2
- 20 Moreland St Unit 1
- 20 Moreland St Unit 2
- 16 Moreland St
- 27 Winthrop St Unit 2
- 27 Winthrop St Unit 1
- 27 Winthrop St
- 27 Winthrop St Unit 3
- 24 Moreland St Unit 26
- 14 Moreland St
- 19 Winthrop St
- 23 Moreland St Unit 2B
- 23 Moreland St Unit 2
- 23 Moreland St
- 23 Moreland St Unit 1
- 17 Winthrop St