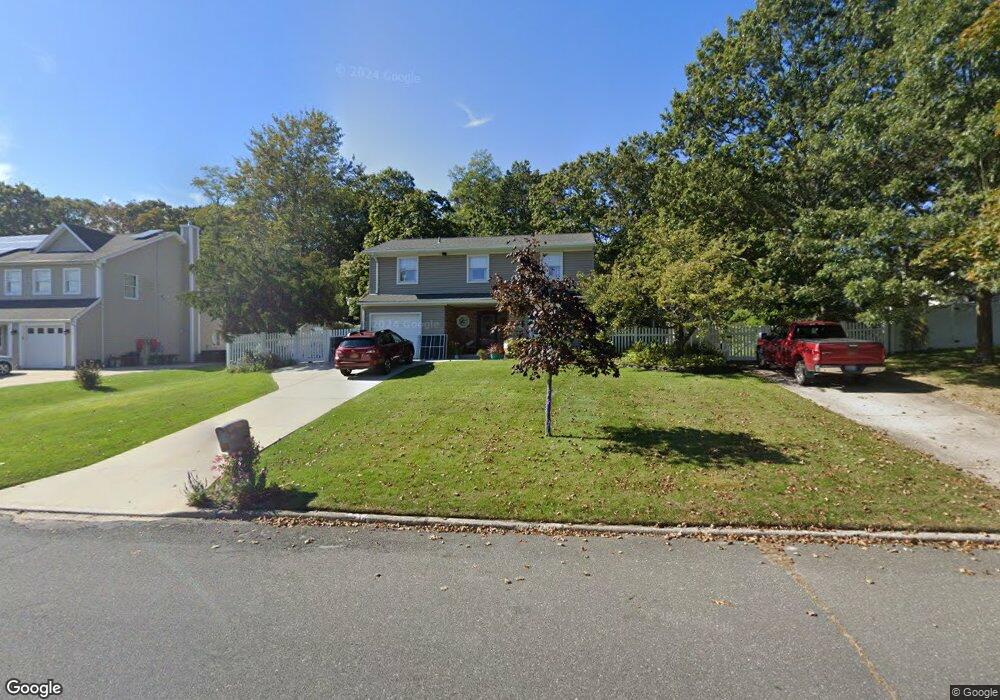
22 N Morris Ave Farmingville, NY 11738
Estimated Value: $636,000 - $752,000
4
Beds
1
Bath
1,776
Sq Ft
$385/Sq Ft
Est. Value
About This Home
This home is located at 22 N Morris Ave, Farmingville, NY 11738 and is currently estimated at $684,499, approximately $385 per square foot. 22 N Morris Ave is a home located in Suffolk County with nearby schools including Chippewa Elementary School, Sagamore Middle School, and Sachem High School East.
Ownership History
Date
Name
Owned For
Owner Type
Purchase Details
Closed on
Feb 13, 2020
Sold by
Fallon Annette
Bought by
Fallon John and Donichod Heidi
Current Estimated Value
Home Financials for this Owner
Home Financials are based on the most recent Mortgage that was taken out on this home.
Original Mortgage
$394,250
Outstanding Balance
$349,081
Interest Rate
3.6%
Mortgage Type
New Conventional
Estimated Equity
$335,418
Purchase Details
Closed on
Jan 31, 2008
Sold by
Fallon Edward Annette
Bought by
Fallon Annette
Create a Home Valuation Report for This Property
The Home Valuation Report is an in-depth analysis detailing your home's value as well as a comparison with similar homes in the area
Home Values in the Area
Average Home Value in this Area
Purchase History
| Date | Buyer | Sale Price | Title Company |
|---|---|---|---|
| Fallon John | $415,000 | None Available | |
| Fallon Annette | -- | Michael Corraran |
Source: Public Records
Mortgage History
| Date | Status | Borrower | Loan Amount |
|---|---|---|---|
| Open | Fallon John | $394,250 |
Source: Public Records
Tax History Compared to Growth
Tax History
| Year | Tax Paid | Tax Assessment Tax Assessment Total Assessment is a certain percentage of the fair market value that is determined by local assessors to be the total taxable value of land and additions on the property. | Land | Improvement |
|---|---|---|---|---|
| 2024 | $12,071 | $3,200 | $300 | $2,900 |
| 2023 | $12,071 | $3,200 | $300 | $2,900 |
| 2022 | $9,696 | $3,200 | $300 | $2,900 |
| 2021 | $9,696 | $3,200 | $300 | $2,900 |
| 2020 | $10,759 | $3,350 | $300 | $3,050 |
| 2019 | $10,759 | $0 | $0 | $0 |
| 2018 | -- | $3,350 | $300 | $3,050 |
| 2017 | $10,021 | $3,350 | $300 | $3,050 |
| 2016 | $9,968 | $3,350 | $300 | $3,050 |
| 2015 | -- | $3,350 | $300 | $3,050 |
| 2014 | -- | $3,350 | $300 | $3,050 |
Source: Public Records
Map
Nearby Homes