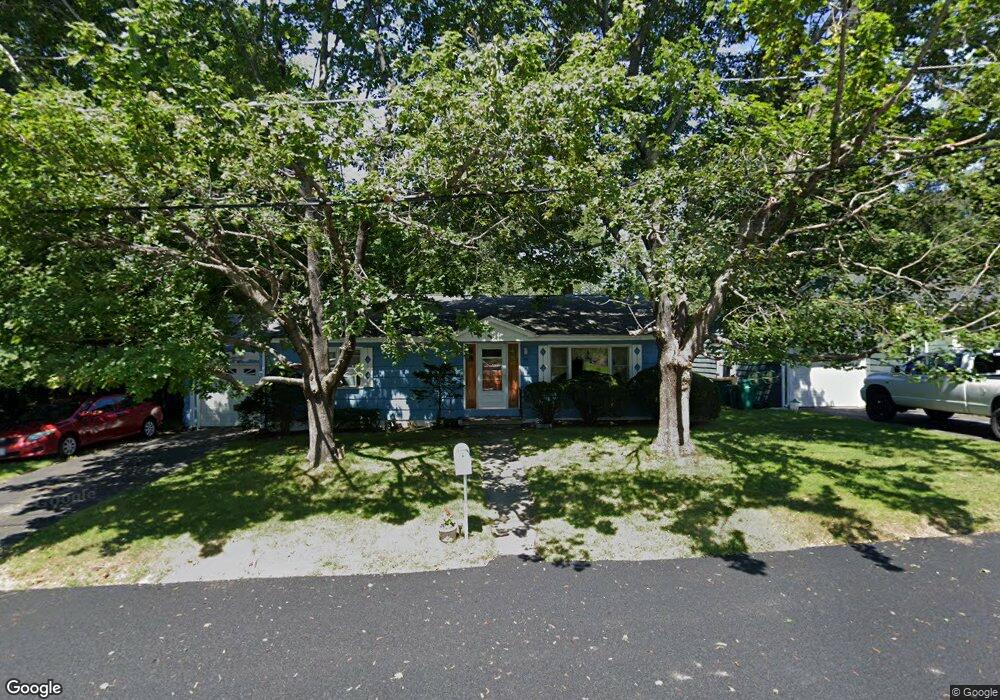
22 Nancy Dr Webster, MA 01570
Estimated Value: $354,000 - $401,000
2
Beds
2
Baths
1,176
Sq Ft
$318/Sq Ft
Est. Value
About This Home
This home is located at 22 Nancy Dr, Webster, MA 01570 and is currently estimated at $374,418, approximately $318 per square foot. 22 Nancy Dr is a home located in Worcester County with nearby schools including Park Avenue Elementary School, Webster Middle School, and Bartlett High School.
Ownership History
Date
Name
Owned For
Owner Type
Purchase Details
Closed on
Nov 22, 2000
Sold by
Desroches Patricia and Smith Herbert J
Bought by
Ciampa Cheryl
Current Estimated Value
Home Financials for this Owner
Home Financials are based on the most recent Mortgage that was taken out on this home.
Original Mortgage
$100,000
Outstanding Balance
$36,585
Interest Rate
7.78%
Mortgage Type
Purchase Money Mortgage
Estimated Equity
$337,833
Create a Home Valuation Report for This Property
The Home Valuation Report is an in-depth analysis detailing your home's value as well as a comparison with similar homes in the area
Home Values in the Area
Average Home Value in this Area
Purchase History
| Date | Buyer | Sale Price | Title Company |
|---|---|---|---|
| Ciampa Cheryl | $105,500 | -- |
Source: Public Records
Mortgage History
| Date | Status | Borrower | Loan Amount |
|---|---|---|---|
| Open | Ciampa Cheryl | $100,000 |
Source: Public Records
Tax History
| Year | Tax Paid | Tax Assessment Tax Assessment Total Assessment is a certain percentage of the fair market value that is determined by local assessors to be the total taxable value of land and additions on the property. | Land | Improvement |
|---|---|---|---|---|
| 2025 | $3,489 | $293,700 | $50,500 | $243,200 |
| 2024 | $3,441 | $282,500 | $48,600 | $233,900 |
| 2023 | $3,073 | $245,800 | $42,000 | $203,800 |
| 2022 | $2,983 | $213,700 | $40,800 | $172,900 |
| 2021 | $2,878 | $190,600 | $40,800 | $149,800 |
| 2020 | $4,866 | $185,500 | $40,800 | $144,700 |
| 2019 | $4,811 | $170,600 | $40,800 | $129,800 |
| 2018 | $4,397 | $157,300 | $40,800 | $116,500 |
| 2017 | $2,313 | $152,900 | $40,000 | $112,900 |
| 2016 | $2,276 | $150,300 | $40,000 | $110,300 |
| 2015 | $2,164 | $147,400 | $39,200 | $108,200 |
Source: Public Records
Map
Nearby Homes
Your Personal Tour Guide
Ask me questions while you tour the home.