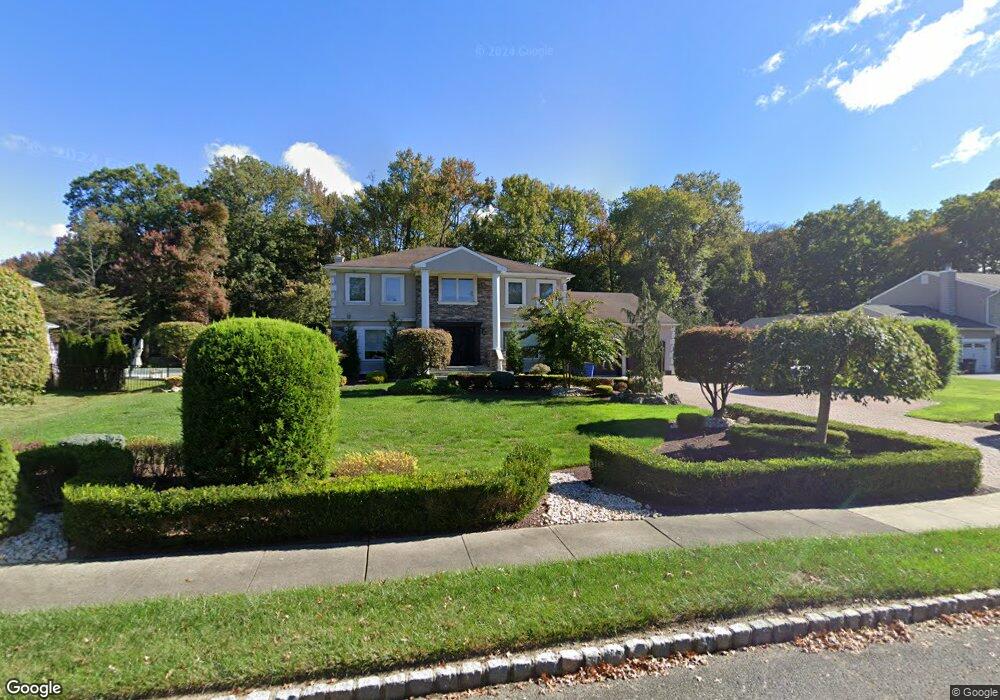
22 Navajo Rd Manalapan, NJ 07726
Estimated Value: $998,000 - $1,094,000
4
Beds
3
Baths
3,089
Sq Ft
$333/Sq Ft
Est. Value
About This Home
This home is located at 22 Navajo Rd, Manalapan, NJ 07726 and is currently estimated at $1,028,946, approximately $333 per square foot. 22 Navajo Rd is a home located in Monmouth County with nearby schools including Clark Mills Elementary School, Pine Brook Elementary School, and Manalapan-Englishtown Middle School.
Ownership History
Date
Name
Owned For
Owner Type
Purchase Details
Closed on
May 3, 2002
Sold by
Mazer Barry
Bought by
Smaldone Anthony and Smaldone Randi
Current Estimated Value
Home Financials for this Owner
Home Financials are based on the most recent Mortgage that was taken out on this home.
Original Mortgage
$150,000
Interest Rate
6.82%
Create a Home Valuation Report for This Property
The Home Valuation Report is an in-depth analysis detailing your home's value as well as a comparison with similar homes in the area
Home Values in the Area
Average Home Value in this Area
Purchase History
| Date | Buyer | Sale Price | Title Company |
|---|---|---|---|
| Smaldone Anthony | $427,000 | -- |
Source: Public Records
Mortgage History
| Date | Status | Borrower | Loan Amount |
|---|---|---|---|
| Previous Owner | Smaldone Anthony | $150,000 |
Source: Public Records
Tax History Compared to Growth
Tax History
| Year | Tax Paid | Tax Assessment Tax Assessment Total Assessment is a certain percentage of the fair market value that is determined by local assessors to be the total taxable value of land and additions on the property. | Land | Improvement |
|---|---|---|---|---|
| 2025 | $15,143 | $976,500 | $374,800 | $601,700 |
| 2024 | $13,810 | $897,100 | $374,800 | $522,300 |
| 2023 | $13,810 | $829,900 | $329,800 | $500,100 |
| 2022 | $13,051 | $731,300 | $255,100 | $476,200 |
| 2021 | $13,051 | $628,800 | $172,300 | $456,500 |
| 2020 | $12,764 | $621,700 | $167,800 | $453,900 |
| 2019 | $12,540 | $610,200 | $194,800 | $415,400 |
| 2018 | $11,563 | $559,400 | $163,300 | $396,100 |
| 2017 | $11,136 | $539,000 | $154,300 | $384,700 |
| 2016 | $10,539 | $516,100 | $136,300 | $379,800 |
| 2015 | $10,557 | $511,500 | $141,500 | $370,000 |
| 2014 | $11,013 | $519,500 | $160,000 | $359,500 |
Source: Public Records
Map
Nearby Homes
- 6 Blackfoot Dr
- 210 Pine Brook Rd
- 224 Union Hill Rd
- 31 Winthrop Dr
- 8 Chesapeake Rd
- 1 Spruce Way
- 70 Overlook Way Unit E
- 9 Joyce Ct
- 56 Tarrytown Rd
- 96 Sofia Dr
- 12 Tori Ln
- 6 Scarlett Terrace
- 75 Overlook Way Unit K
- 86 Arrowood Rd Unit B
- 93 Arrowood Rd Unit G
- 33 Denise Ct
- 22 Denise Ct
- 4 Vicksburg Dr
- 544 Union Hill Rd
- 0-0 Union Hill Rd