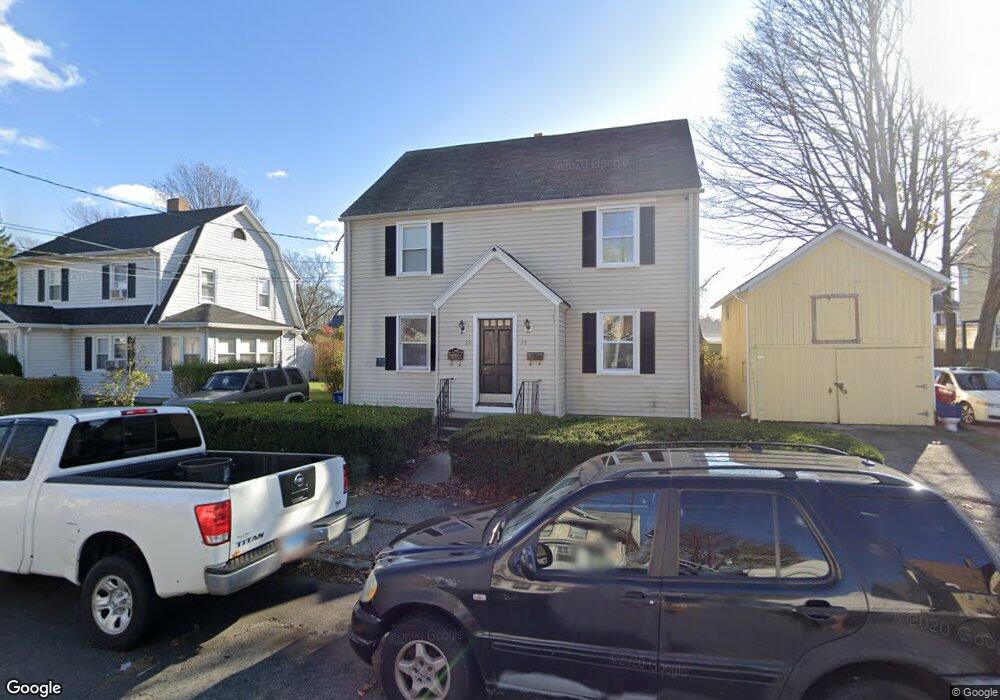
22 Nelson Terrace Unit 24 Bridgeport, CT 06610
North Bridgeport NeighborhoodEstimated Value: $450,348 - $559,000
4
Beds
2
Baths
2,433
Sq Ft
$206/Sq Ft
Est. Value
About This Home
This home is located at 22 Nelson Terrace Unit 24, Bridgeport, CT 06610 and is currently estimated at $502,337, approximately $206 per square foot. 22 Nelson Terrace Unit 24 is a home located in Fairfield County with nearby schools including Read School, Harding High School, and Achievement First Bridgeport Academy Elementary School.
Ownership History
Date
Name
Owned For
Owner Type
Purchase Details
Closed on
Aug 15, 2003
Sold by
Brideau Kevin and Kealey Anne
Bought by
Pirre Judith and Delimar Amilcar
Current Estimated Value
Home Financials for this Owner
Home Financials are based on the most recent Mortgage that was taken out on this home.
Original Mortgage
$250,908
Outstanding Balance
$109,201
Interest Rate
5.46%
Estimated Equity
$393,136
Purchase Details
Closed on
Sep 10, 1999
Sold by
Patria Joseph P and Patria Marion
Bought by
Brideau Kevin and Kealey Anne
Home Financials for this Owner
Home Financials are based on the most recent Mortgage that was taken out on this home.
Original Mortgage
$110,500
Interest Rate
7.65%
Purchase Details
Closed on
Sep 1, 1988
Sold by
Memoli Gene
Bought by
Patria Joseph
Purchase Details
Closed on
Apr 8, 1988
Sold by
Ambrisco Stephen
Bought by
Memoli Gene
Create a Home Valuation Report for This Property
The Home Valuation Report is an in-depth analysis detailing your home's value as well as a comparison with similar homes in the area
Home Values in the Area
Average Home Value in this Area
Purchase History
| Date | Buyer | Sale Price | Title Company |
|---|---|---|---|
| Pirre Judith | $252,900 | -- | |
| Pirre Judith | $252,900 | -- | |
| Brideau Kevin | $130,000 | -- | |
| Brideau Kevin | $130,000 | -- | |
| Patria Joseph | $172,500 | -- | |
| Memoli Gene | $157,000 | -- |
Source: Public Records
Mortgage History
| Date | Status | Borrower | Loan Amount |
|---|---|---|---|
| Open | Memoli Gene | $250,908 | |
| Closed | Memoli Gene | $250,908 | |
| Previous Owner | Memoli Gene | $110,500 |
Source: Public Records
Tax History Compared to Growth
Tax History
| Year | Tax Paid | Tax Assessment Tax Assessment Total Assessment is a certain percentage of the fair market value that is determined by local assessors to be the total taxable value of land and additions on the property. | Land | Improvement |
|---|---|---|---|---|
| 2025 | $6,883 | $158,410 | $50,900 | $107,510 |
| 2024 | $6,883 | $158,410 | $50,900 | $107,510 |
| 2023 | $6,883 | $158,410 | $50,900 | $107,510 |
| 2022 | $6,883 | $158,410 | $50,900 | $107,510 |
| 2021 | $6,883 | $158,410 | $50,900 | $107,510 |
| 2020 | $7,384 | $136,760 | $49,180 | $87,580 |
| 2019 | $7,384 | $136,760 | $49,180 | $87,580 |
| 2018 | $7,436 | $136,760 | $49,180 | $87,580 |
| 2017 | $7,436 | $136,760 | $49,180 | $87,580 |
| 2016 | $7,436 | $136,760 | $49,180 | $87,580 |
| 2015 | $7,273 | $172,350 | $53,790 | $118,560 |
| 2014 | $7,273 | $172,350 | $53,790 | $118,560 |
Source: Public Records
Map
Nearby Homes
- 2463 E Main St
- 149 Edna Ave Unit 153
- 83 Berkeley Place Unit 85
- 33 Louisiana Ave Unit 35
- 132 Virginia Ave Unit 132
- 94 Virginia Ave Unit 94
- 2031 E Main St
- 11 Nob Hill Cir
- 142 Palm St
- 120 Huntington Turnpike Unit 202
- 120 Huntington Turnpike Unit 606
- 120 Huntington Turnpike Unit 801
- 206 Huntington Turnpike
- 199 Bradley St Unit 203
- 202 Goddard Ave
- 105 Asylum St
- 50 Goddard Ave
- 110 Asylum St
- 197 Dupont Place Unit 199
- 165 Nutmeg Rd
- 2320 E Main St
- 25 Nelson Terrace Unit 27
- 2366 E Main St
- 30 Nelson Terrace
- 297 Alpine St
- 2343 E Main St
- 2341 E Main St
- 2316 E Main St
- 2312 E Main St
- 2353 E Main St
- 307 Alpine St
- 29 Nelson Terrace
- 2335 E Main St Unit 1
- 50 Nelson Terrace
- 35 Nelson Terrace
- 2374 E Main St
- 2374 E Main St Unit 3RD F
- 315 Alpine St
- 2313 E Main St Unit 1
- 2313 E Main St Unit 1st