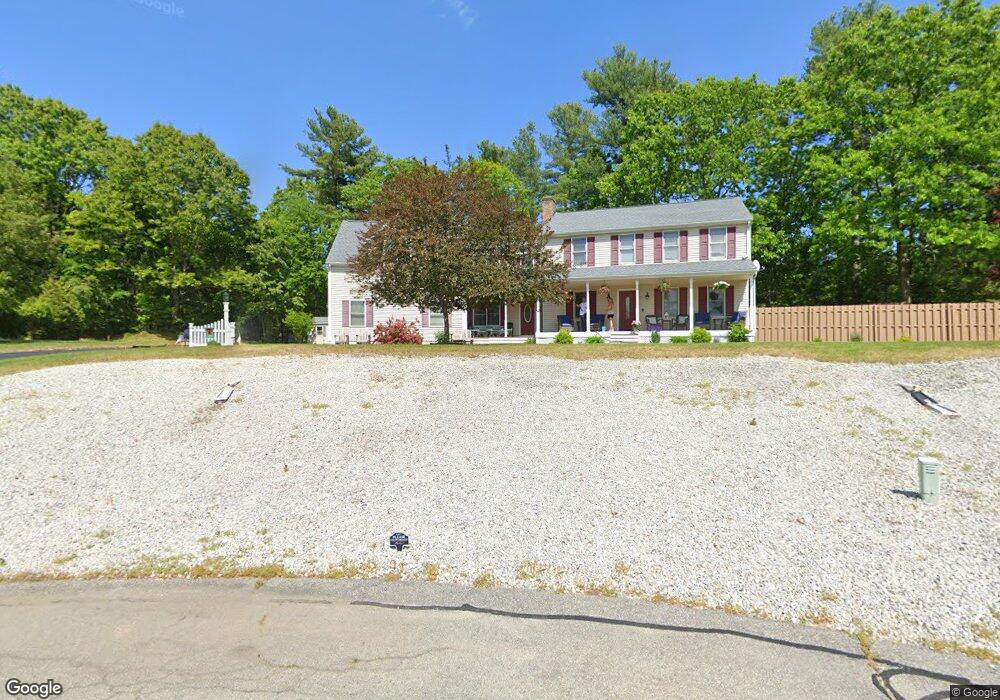
22 No Way Uxbridge, MA 01569
Estimated Value: $656,391 - $681,000
3
Beds
3
Baths
2,733
Sq Ft
$245/Sq Ft
Est. Value
About This Home
This home is located at 22 No Way, Uxbridge, MA 01569 and is currently estimated at $669,848, approximately $245 per square foot. 22 No Way is a home located in Worcester County with nearby schools including Uxbridge High School and Our Lady of the Valley Regional School.
Ownership History
Date
Name
Owned For
Owner Type
Purchase Details
Closed on
Nov 4, 1997
Sold by
Fred Hutnak Dev Corp
Bought by
Peniche Albino R and Prniche Jennifer
Current Estimated Value
Create a Home Valuation Report for This Property
The Home Valuation Report is an in-depth analysis detailing your home's value as well as a comparison with similar homes in the area
Home Values in the Area
Average Home Value in this Area
Purchase History
| Date | Buyer | Sale Price | Title Company |
|---|---|---|---|
| Peniche Albino R | $157,500 | -- |
Source: Public Records
Mortgage History
| Date | Status | Borrower | Loan Amount |
|---|---|---|---|
| Open | Peniche Albino R | $326,922 | |
| Closed | Peniche Albino R | $175,000 | |
| Closed | Peniche Albino R | $16,000 |
Source: Public Records
Tax History
| Year | Tax Paid | Tax Assessment Tax Assessment Total Assessment is a certain percentage of the fair market value that is determined by local assessors to be the total taxable value of land and additions on the property. | Land | Improvement |
|---|---|---|---|---|
| 2025 | $71 | $543,500 | $153,000 | $390,500 |
| 2024 | $6,758 | $523,100 | $145,200 | $377,900 |
| 2023 | $6,456 | $462,800 | $125,600 | $337,200 |
| 2022 | $5,841 | $385,300 | $109,900 | $275,400 |
| 2021 | $6,057 | $382,900 | $107,500 | $275,400 |
| 2020 | $6,155 | $367,700 | $106,000 | $261,700 |
| 2019 | $6,159 | $355,000 | $106,000 | $249,000 |
| 2018 | $5,917 | $344,600 | $106,000 | $238,600 |
| 2017 | $6,114 | $360,500 | $103,600 | $256,900 |
| 2016 | $6,332 | $360,400 | $95,000 | $265,400 |
| 2015 | $6,187 | $355,600 | $95,000 | $260,600 |
Source: Public Records
Map
Nearby Homes
- 25 Dunny Cove Ln
- 35 Pouts Ln
- 20 Nature View Dr Unit 20
- 24 Olde Canal Way Unit 24
- 37 Elizabeth St
- 13A Asylum St
- 50 Carrington Ln
- 4 Strathmore Shire Dr Unit B
- 3 Strathmore Shire Unit A
- 27 Taft Ave
- 53 Asylum St
- 23 Uxbridge Rd
- 0 Louis St
- 288-290 Providence Rd
- 62 Millville Rd
- 251 Union St
- 307 N Main St
- 13 Blanchard Ave
- 4 Moon Hill Rd
- 3 Moon Hill Rd