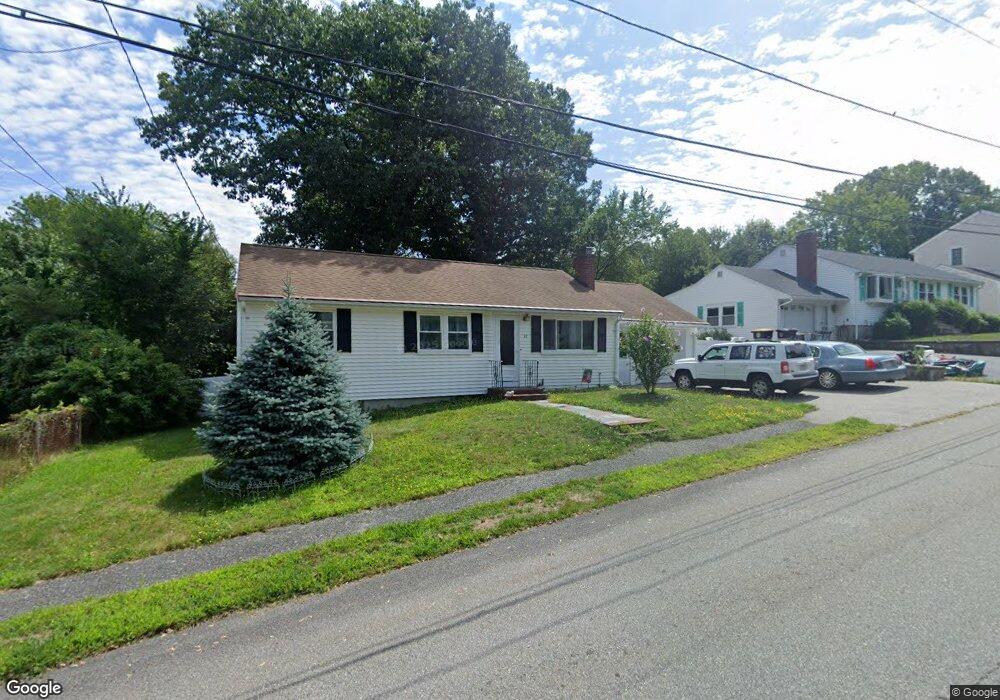
22 Norma Ave Weymouth, MA 02188
Weymouth Landing NeighborhoodEstimated Value: $532,000 - $584,000
3
Beds
1
Bath
912
Sq Ft
$609/Sq Ft
Est. Value
About This Home
This home is located at 22 Norma Ave, Weymouth, MA 02188 and is currently estimated at $554,966, approximately $608 per square foot. 22 Norma Ave is a home located in Norfolk County with nearby schools including Frederick C Murphy, Abigail Adams Middle School, and Weymouth Middle School Chapman.
Ownership History
Date
Name
Owned For
Owner Type
Purchase Details
Closed on
May 19, 2017
Sold by
Tarbi Helen M
Bought by
Hampton Rt
Current Estimated Value
Purchase Details
Closed on
Nov 26, 2003
Sold by
Castellano Michael A and Smith-Castellano Anne
Bought by
Tarbi Helen M
Home Financials for this Owner
Home Financials are based on the most recent Mortgage that was taken out on this home.
Original Mortgage
$234,600
Interest Rate
6.09%
Mortgage Type
Purchase Money Mortgage
Create a Home Valuation Report for This Property
The Home Valuation Report is an in-depth analysis detailing your home's value as well as a comparison with similar homes in the area
Home Values in the Area
Average Home Value in this Area
Purchase History
| Date | Buyer | Sale Price | Title Company |
|---|---|---|---|
| Hampton Rt | -- | -- | |
| Tarbi Helen M | $309,555 | -- |
Source: Public Records
Mortgage History
| Date | Status | Borrower | Loan Amount |
|---|---|---|---|
| Previous Owner | Tarbi Helen M | $234,600 |
Source: Public Records
Tax History
| Year | Tax Paid | Tax Assessment Tax Assessment Total Assessment is a certain percentage of the fair market value that is determined by local assessors to be the total taxable value of land and additions on the property. | Land | Improvement |
|---|---|---|---|---|
| 2025 | $4,953 | $490,400 | $219,000 | $271,400 |
| 2024 | $4,797 | $467,100 | $208,600 | $258,500 |
| 2023 | $4,617 | $441,800 | $193,200 | $248,600 |
| 2022 | $4,508 | $393,400 | $178,900 | $214,500 |
| 2021 | $4,130 | $351,800 | $178,900 | $172,900 |
| 2020 | $3,936 | $330,200 | $178,900 | $151,300 |
| 2019 | $3,779 | $311,800 | $172,000 | $139,800 |
| 2018 | $3,668 | $293,400 | $163,800 | $129,600 |
| 2017 | $3,632 | $283,500 | $156,000 | $127,500 |
| 2016 | $3,489 | $272,600 | $150,000 | $122,600 |
| 2015 | $3,287 | $254,800 | $143,200 | $111,600 |
| 2014 | $3,197 | $240,400 | $133,300 | $107,100 |
Source: Public Records
Map
Nearby Homes
- 107 Summer St
- 15 Summer St
- 82 Lester Ln
- 33 Congress St
- 122 Washington St Unit Twenty-two
- 11 Richmond St
- 25 Richmond St
- 37 Lantern Ln
- 19 Vine St Unit 3
- 19 Vine St Unit 2
- 41 Lantern Ln
- 46 Roosevelt Rd
- 31 Doris Rd
- 300 Commercial St Unit 23
- 54 Edgemont Rd
- 16 Beechwood Rd
- 211 Roosevelt Rd
- 26 Tingley Rd
- 501 Commerce Dr Unit 2310
- 501 Commerce Dr Unit 4308
Your Personal Tour Guide
Ask me questions while you tour the home.