22 Northern Blvd Staten Island, NY 10301
Sunnyside NeighborhoodEstimated Value: $816,000 - $954,000
3
Beds
2
Baths
1,539
Sq Ft
$585/Sq Ft
Est. Value
About This Home
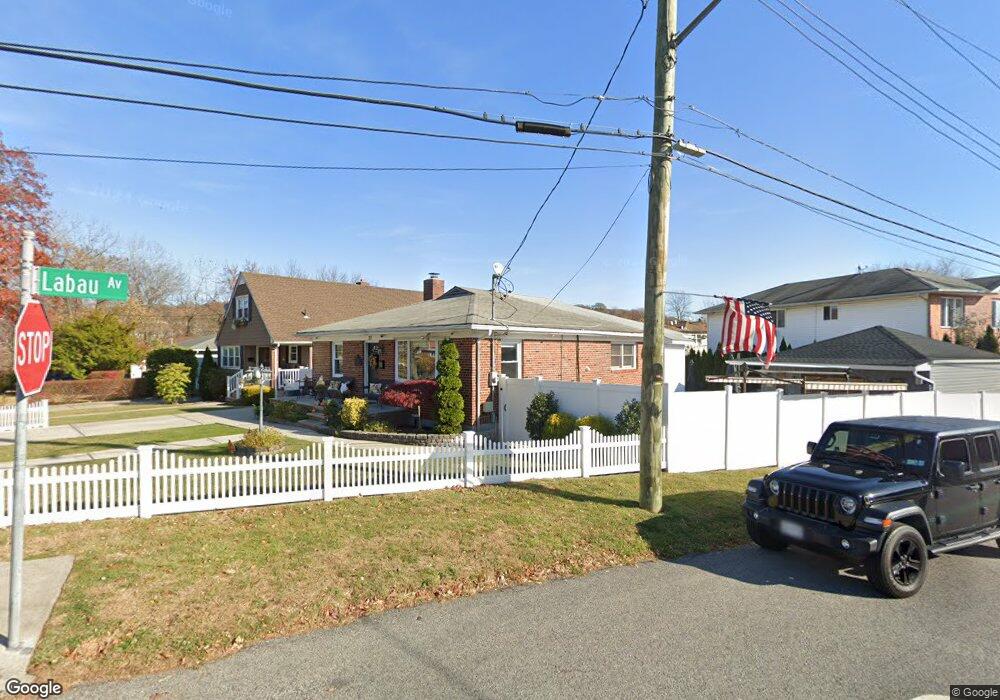
This home is located at 22 Northern Blvd, Staten Island, NY 10301 and is currently estimated at $900,554, approximately $585 per square foot. 22 Northern Blvd is a home located in Richmond County with nearby schools including P.S. 35 The Clove Valley School, Intermediate School 27, and Curtis High School.
Ownership History
Date
Name
Owned For
Owner Type
Purchase Details
Closed on
Feb 3, 2021
Sold by
Antenucci Anthony F and Antenucci Geraldine
Bought by
Antenucci Jamie and Antenucci Anthony
Current Estimated Value
Purchase Details
Closed on
Jul 28, 2011
Sold by
Shinners Matthew and Shinners Christa
Bought by
Antenucci Jamie and Antenucci Anthony F
Home Financials for this Owner
Home Financials are based on the most recent Mortgage that was taken out on this home.
Original Mortgage
$468,135
Outstanding Balance
$326,836
Interest Rate
4.75%
Mortgage Type
FHA
Estimated Equity
$573,718
Purchase Details
Closed on
Oct 24, 2003
Sold by
Gallo Joseph and Gallo Lewis F
Bought by
Shinners Matthew and Shinner Christa
Home Financials for this Owner
Home Financials are based on the most recent Mortgage that was taken out on this home.
Original Mortgage
$156,800
Interest Rate
5.8%
Mortgage Type
Purchase Money Mortgage
Purchase Details
Closed on
Dec 26, 1996
Sold by
Gallo Joseph
Bought by
Gallo Lewis F and Gallo Suzanne M
Create a Home Valuation Report for This Property
The Home Valuation Report is an in-depth analysis detailing your home's value as well as a comparison with similar homes in the area
Home Values in the Area
Average Home Value in this Area
Purchase History
| Date | Buyer | Sale Price | Title Company |
|---|---|---|---|
| Antenucci Jamie | -- | Express Abstract Svcs Inc | |
| Antenucci Jamie | $515,000 | None Available | |
| Shinners Matthew | $325,000 | Custom Title Services Inc | |
| Gallo Lewis F | -- | -- |
Source: Public Records
Mortgage History
| Date | Status | Borrower | Loan Amount |
|---|---|---|---|
| Open | Antenucci Jamie | $468,135 | |
| Previous Owner | Shinners Matthew | $156,800 |
Source: Public Records
Tax History Compared to Growth
Tax History
| Year | Tax Paid | Tax Assessment Tax Assessment Total Assessment is a certain percentage of the fair market value that is determined by local assessors to be the total taxable value of land and additions on the property. | Land | Improvement |
|---|---|---|---|---|
| 2025 | $6,868 | $59,940 | $12,018 | $47,922 |
| 2024 | $6,868 | $54,780 | $12,434 | $42,346 |
| 2023 | $6,898 | $33,967 | $12,728 | $21,239 |
| 2022 | $6,731 | $45,600 | $19,920 | $25,680 |
| 2021 | $6,405 | $41,280 | $19,920 | $21,360 |
| 2020 | $6,083 | $40,020 | $19,920 | $20,100 |
| 2019 | $5,668 | $43,440 | $19,920 | $23,520 |
| 2018 | $5,473 | $28,306 | $12,873 | $15,433 |
| 2017 | $5,428 | $28,099 | $14,808 | $13,291 |
| 2016 | $5,000 | $26,563 | $14,922 | $11,641 |
| 2015 | $4,252 | $25,113 | $11,711 | $13,402 |
| 2014 | $4,252 | $23,745 | $13,288 | $10,457 |
Source: Public Records
Map
Nearby Homes
- 19 Renwick Ave
- 35 Cypress Ave
- 98 Logan Ave
- 18 Dobbs Place
- 150 Dudley Ave
- 1197 Clove Rd
- 1380 Clove Rd
- 1384 Clove Rd
- 1386 Clove Rd
- 125 Tioga St
- 1428 Victory Blvd
- 159 Seneca Ave
- 144 Beverly Ave
- 0 Clove Rd
- 346 Little Clove Rd
- 86 Tioga St
- 124 van Cortlandt Ave
- 1100 Clove Rd Unit 2N
- 1100 Clove Rd Unit 6D
- 1100 Clove Rd Unit G0