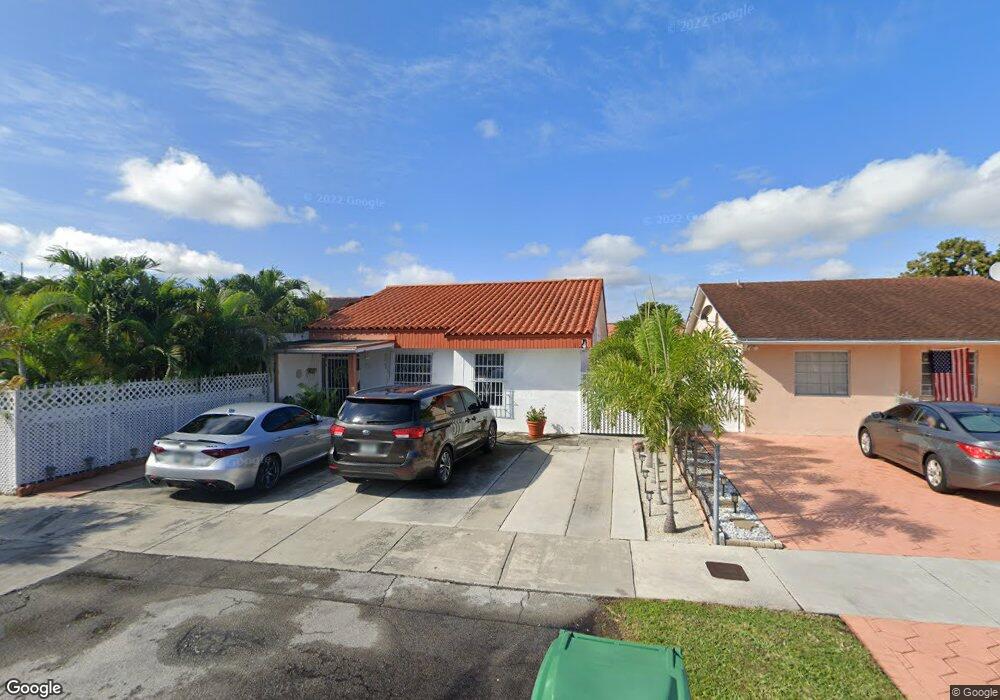
22 NW 108th Ct Unit NORTH Miami, FL 33172
Fontainebleau Park West NeighborhoodEstimated Value: $366,000 - $459,000
3
Beds
2
Baths
1,507
Sq Ft
$264/Sq Ft
Est. Value
About This Home
This home is located at 22 NW 108th Ct Unit NORTH, Miami, FL 33172 and is currently estimated at $397,272, approximately $263 per square foot. 22 NW 108th Ct Unit NORTH is a home located in Miami-Dade County with nearby schools including Sweetwater Elementary School, Ruben Dario Middle School, and Miami Coral Park Senior High School.
Ownership History
Date
Name
Owned For
Owner Type
Purchase Details
Closed on
May 24, 2021
Sold by
Toledo Roger and Ayestas Iris Sarai
Bought by
Toledo Roger Orlando and Ayestas Iris Sarai
Current Estimated Value
Home Financials for this Owner
Home Financials are based on the most recent Mortgage that was taken out on this home.
Original Mortgage
$60,000
Outstanding Balance
$36,116
Interest Rate
2.9%
Mortgage Type
New Conventional
Estimated Equity
$361,156
Purchase Details
Closed on
Apr 22, 2017
Sold by
Suarez Elida and Mir Catalino D
Bought by
Mir Catalino D and Suarez Elida
Purchase Details
Closed on
Aug 2, 1996
Sold by
Lima Vilma
Bought by
Suarez Elida and Toledo Roger
Home Financials for this Owner
Home Financials are based on the most recent Mortgage that was taken out on this home.
Original Mortgage
$92,700
Interest Rate
8.26%
Mortgage Type
New Conventional
Create a Home Valuation Report for This Property
The Home Valuation Report is an in-depth analysis detailing your home's value as well as a comparison with similar homes in the area
Home Values in the Area
Average Home Value in this Area
Purchase History
| Date | Buyer | Sale Price | Title Company |
|---|---|---|---|
| Toledo Roger Orlando | -- | Colonial Title Services Inc | |
| Toledo Roger Orlando | -- | Colonial Title | |
| Mir Catalino D | -- | Attorney | |
| Suarez Elida | $103,000 | -- |
Source: Public Records
Mortgage History
| Date | Status | Borrower | Loan Amount |
|---|---|---|---|
| Open | Toledo Roger Orlando | $60,000 | |
| Previous Owner | Suarez Elida | $92,700 |
Source: Public Records
Tax History Compared to Growth
Tax History
| Year | Tax Paid | Tax Assessment Tax Assessment Total Assessment is a certain percentage of the fair market value that is determined by local assessors to be the total taxable value of land and additions on the property. | Land | Improvement |
|---|---|---|---|---|
| 2025 | $2,160 | $133,453 | -- | -- |
| 2024 | $1,956 | $129,692 | -- | -- |
| 2023 | $1,956 | $125,915 | $0 | $0 |
| 2022 | $1,929 | $122,248 | $0 | $0 |
| 2021 | $1,890 | $118,688 | $0 | $0 |
| 2020 | $3,473 | $207,480 | $0 | $0 |
| 2019 | $1,338 | $114,419 | $0 | $0 |
| 2018 | $0 | $112,286 | $0 | $0 |
| 2017 | $1,194 | $109,977 | $0 | $0 |
| 2016 | $1,192 | $107,715 | $0 | $0 |
| 2015 | $1,158 | $106,967 | $0 | $0 |
| 2014 | $1,158 | $106,119 | $0 | $0 |
Source: Public Records
Map
Nearby Homes
- 13 NW 108th Ct
- 10 SW 108th Ave Unit E8
- 20 SW 108th Ave Unit F7
- 10851 SW 2nd St Unit K106
- 10851 SW 2nd St Unit K111
- 10851 SW 2nd St Unit K304
- 10745 SW 3rd St Unit 8
- 10904 SW 2nd St
- 290 NW 109th Ave Unit 103
- 173 NW 107th St
- 315 NW 109th Ave Unit 205
- 310 NW 107th Ave Unit 208
- 11005 SW 1st St Unit 207
- 250 NW 107th Ave Unit 202
- 401 SW 109th Ave Unit 26
- 11195 SW 1st St Unit 314
- 10881 SW 6th St Unit 7
- 11217 SW 1st St Unit 5
- 11220 SW 2nd St
- 570 NW 109th Ave Unit 1205
- 21 NW 108th Ct Unit SOUTH
- 4 NW 108th Ct Unit NORTH
- 10851 W Flagler St Unit 62
- 10841 W Flagler St Unit 72
- 2 NW 108th Place Unit SOUTH
- 41 NW 108th Ct Unit SOUTH
- 40 NW 108th Ct Unit SOUTH
- 32 NW 108th Ct Unit NORTH
- 12 NW 108th Ct
- 30 NW 108th Ct Unit SOUTH
- 31 NW 108th Ct Unit SOUTH
- 33 NW 108th Ct Unit NORTH
- 31 NW 108th Ct Unit 1
- 11 NW 108th Place Unit 62
- 10831 W Flagler St Unit 131
- 10 NW 108th Ct Unit SOUTH
- 11 NW 108th Ct Unit SOUTH
- 23 NW 108th Ct Unit NORTH
- 20 NW 108th Ct Unit SOUTH
- 5 NW 108th Ct Unit NORTH