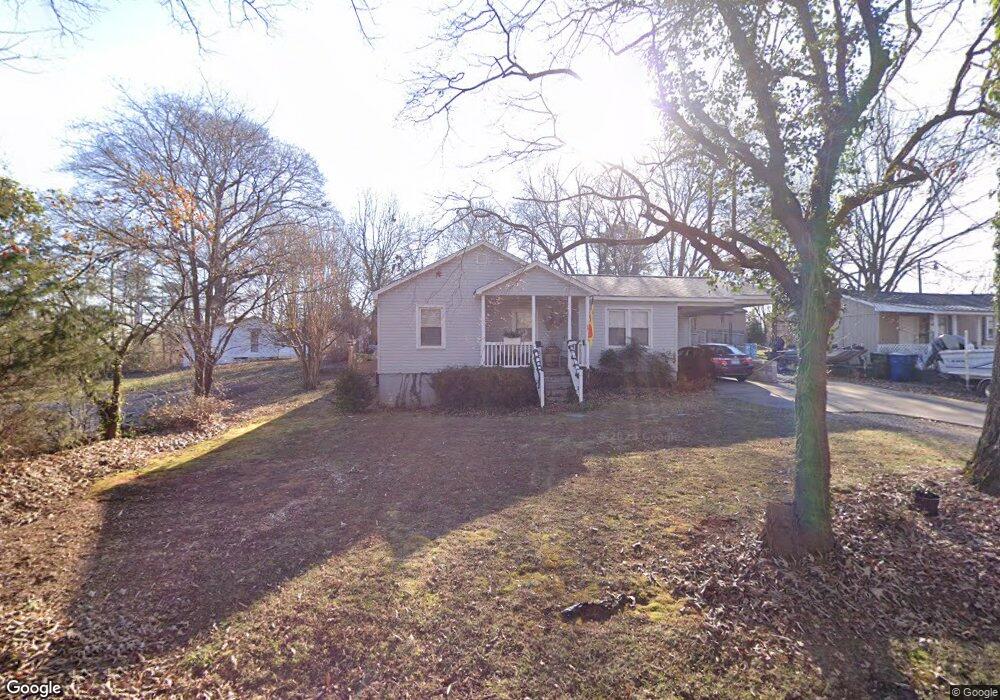
22 Oak Grove St Mount Holly, NC 28120
Estimated Value: $256,000 - $285,000
3
Beds
2
Baths
1,215
Sq Ft
$219/Sq Ft
Est. Value
About This Home
This home is located at 22 Oak Grove St, Mount Holly, NC 28120 and is currently estimated at $266,266, approximately $219 per square foot. 22 Oak Grove St is a home located in Gaston County with nearby schools including Rankin Elementary School, Mount Holly Middle School, and Stuart W. Cramer High School.
Ownership History
Date
Name
Owned For
Owner Type
Purchase Details
Closed on
Jul 19, 2018
Sold by
Bynum Joey Phillips
Bought by
Bynum Daford R and Bynum Danford Ray
Current Estimated Value
Home Financials for this Owner
Home Financials are based on the most recent Mortgage that was taken out on this home.
Original Mortgage
$92,000
Outstanding Balance
$67,996
Interest Rate
4.5%
Mortgage Type
Credit Line Revolving
Estimated Equity
$198,270
Purchase Details
Closed on
Oct 21, 2002
Sold by
Bynum Mack Lee
Bought by
Bynum Danford R
Home Financials for this Owner
Home Financials are based on the most recent Mortgage that was taken out on this home.
Original Mortgage
$52,000
Interest Rate
6.18%
Purchase Details
Closed on
Oct 11, 2001
Sold by
Davenport Allan M and Davenport Vivian A
Bought by
Bynum Danford R and Bynum Mack Lee
Home Financials for this Owner
Home Financials are based on the most recent Mortgage that was taken out on this home.
Original Mortgage
$39,630
Interest Rate
6.87%
Mortgage Type
Construction
Create a Home Valuation Report for This Property
The Home Valuation Report is an in-depth analysis detailing your home's value as well as a comparison with similar homes in the area
Home Values in the Area
Average Home Value in this Area
Purchase History
| Date | Buyer | Sale Price | Title Company |
|---|---|---|---|
| Bynum Daford R | -- | None Available | |
| Bynum Danford R | -- | -- | |
| Bynum Danford R | $38,000 | -- |
Source: Public Records
Mortgage History
| Date | Status | Borrower | Loan Amount |
|---|---|---|---|
| Open | Bynum Daford R | $92,000 | |
| Closed | Bynum Danford R | $52,000 | |
| Closed | Bynum Danford R | $39,630 |
Source: Public Records
Tax History Compared to Growth
Tax History
| Year | Tax Paid | Tax Assessment Tax Assessment Total Assessment is a certain percentage of the fair market value that is determined by local assessors to be the total taxable value of land and additions on the property. | Land | Improvement |
|---|---|---|---|---|
| 2025 | $2,043 | $203,510 | $20,000 | $183,510 |
| 2024 | $2,069 | $206,100 | $20,000 | $186,100 |
| 2023 | $2,092 | $206,100 | $20,000 | $186,100 |
| 2022 | $1,395 | $107,750 | $16,000 | $91,750 |
| 2021 | $1,417 | $107,750 | $16,000 | $91,750 |
| 2019 | $1,428 | $107,750 | $16,000 | $91,750 |
| 2018 | $904 | $64,602 | $18,000 | $46,602 |
| 2017 | $904 | $64,602 | $18,000 | $46,602 |
| 2016 | $562 | $64,602 | $0 | $0 |
| 2014 | $678 | $66,322 | $22,500 | $43,822 |
Source: Public Records
Map
Nearby Homes
- 117 Quality Dr
- 227 W Glendale Ave
- 413 W Glendale Ave
- 00 Bell St
- 703 Rankin Ave
- 101 Loya St
- 217 Highland St
- 3631 Azalea Ridge Dr
- 408 E Catawba Ave
- 201 1st St
- 102 Woodstone Dr
- 422 Wilson St
- 433 W Central Ave
- 101 Madison Dr
- 225 N Lee St
- 609 Elm St
- 621 Herms Ave
- 613 Elm St
- 205 Mauney St
- 5235 Clearwater Lake Rd
- 20 Oak Grove St
- 24 Oak Grove St
- 18 Oak Grove St
- 21 Oak Grove St
- 614 S Main St
- 614 S Main St Unit L 20-23
- 16 Oak Grove St Unit C
- 16 Oak Grove St Unit D
- 16 Oak Grove St Unit C 3
- 16 Oak Grove St Unit C 2
- 16 Oak Grove St
- 16 Oak Grove St Unit 6
- 16 Oak Grove St Unit 7, 8 & 9
- 16 Oak Grove St Unit 8
- 16 Oak Grove St Unit 7
- 16 Oak Grove St Unit 9
- 16 Oak Grove St Unit 8
- 16 Oak Grove St Unit 4-5
- 616 S Main St
- 606 S Main St