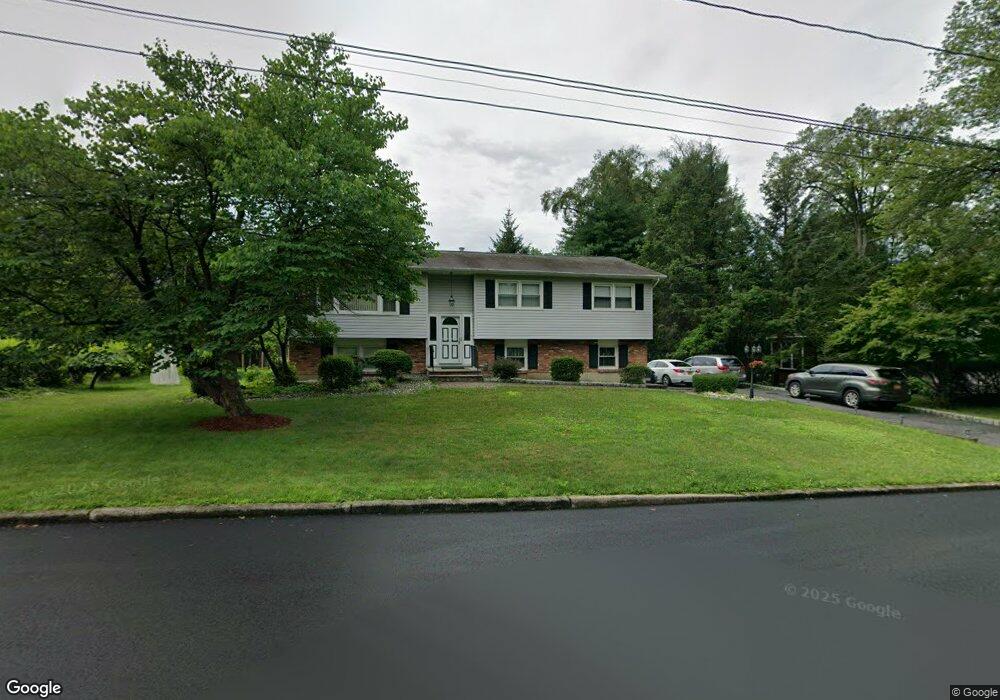
22 Old Brick Rd New City, NY 10956
Estimated Value: $770,000 - $856,492
5
Beds
3
Baths
2,624
Sq Ft
$314/Sq Ft
Est. Value
About This Home
This home is located at 22 Old Brick Rd, New City, NY 10956 and is currently estimated at $823,623, approximately $313 per square foot. 22 Old Brick Rd is a home located in Rockland County with nearby schools including Link Elementary School, Felix Festa Middle School, and Clarkstown High School South.
Ownership History
Date
Name
Owned For
Owner Type
Purchase Details
Closed on
Jul 14, 2011
Sold by
Deforest Lynn E and The Estate Of Alice K Deforest
Bought by
Abraham Binu K and Abraham Binu Saramma
Current Estimated Value
Home Financials for this Owner
Home Financials are based on the most recent Mortgage that was taken out on this home.
Original Mortgage
$357,600
Outstanding Balance
$245,052
Interest Rate
4.58%
Mortgage Type
New Conventional
Estimated Equity
$578,571
Create a Home Valuation Report for This Property
The Home Valuation Report is an in-depth analysis detailing your home's value as well as a comparison with similar homes in the area
Home Values in the Area
Average Home Value in this Area
Purchase History
| Date | Buyer | Sale Price | Title Company |
|---|---|---|---|
| Abraham Binu K | $447,000 | None Available | |
| Abraham Binu K | $447,000 | None Available | |
| Abraham Binu K | $447,000 | None Available |
Source: Public Records
Mortgage History
| Date | Status | Borrower | Loan Amount |
|---|---|---|---|
| Open | Abraham Binu K | $357,600 | |
| Closed | Abraham Binu K | $357,600 |
Source: Public Records
Tax History Compared to Growth
Tax History
| Year | Tax Paid | Tax Assessment Tax Assessment Total Assessment is a certain percentage of the fair market value that is determined by local assessors to be the total taxable value of land and additions on the property. | Land | Improvement |
|---|---|---|---|---|
| 2024 | $17,774 | $137,600 | $32,500 | $105,100 |
| 2023 | $17,774 | $143,900 | $32,500 | $111,400 |
| 2022 | $13,466 | $143,900 | $32,500 | $111,400 |
| 2021 | $13,466 | $143,900 | $32,500 | $111,400 |
| 2020 | $13,655 | $143,900 | $32,500 | $111,400 |
| 2019 | $13,053 | $143,900 | $32,500 | $111,400 |
| 2018 | $13,053 | $143,900 | $32,500 | $111,400 |
| 2017 | $12,719 | $143,900 | $32,500 | $111,400 |
| 2016 | $12,010 | $136,400 | $32,500 | $103,900 |
| 2015 | -- | $136,400 | $32,500 | $103,900 |
| 2014 | -- | $136,400 | $32,500 | $103,900 |
Source: Public Records
Map
Nearby Homes