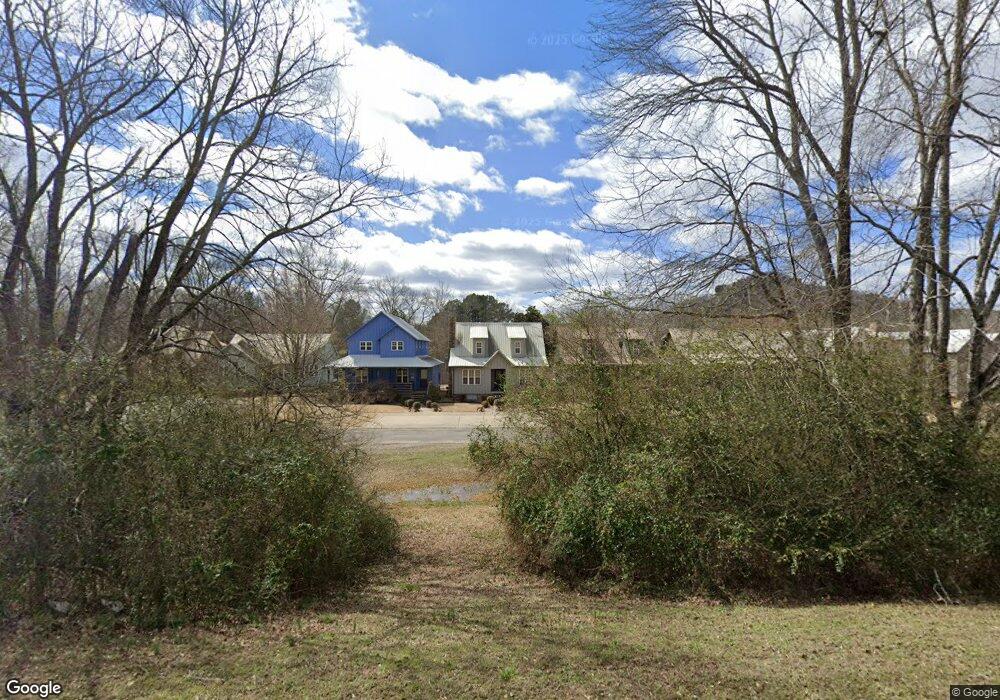
22 Old Ford Way Heber Springs, AR 72543
Estimated Value: $234,167 - $297,000
--
Bed
--
Bath
1,476
Sq Ft
$189/Sq Ft
Est. Value
About This Home
This home is located at 22 Old Ford Way, Heber Springs, AR 72543 and is currently estimated at $278,542, approximately $188 per square foot. 22 Old Ford Way is a home with nearby schools including Heber Springs Elementary School, Heber Springs Middle School, and Heber Springs High School.
Ownership History
Date
Name
Owned For
Owner Type
Purchase Details
Closed on
Nov 17, 2020
Sold by
Vista Investments Llc
Bought by
Esentan Michelle
Current Estimated Value
Purchase Details
Closed on
Nov 25, 2008
Sold by
Faehling-Limbaugh Jean
Bought by
Vista Investments Llc
Home Financials for this Owner
Home Financials are based on the most recent Mortgage that was taken out on this home.
Original Mortgage
$144,500
Interest Rate
6.5%
Mortgage Type
Future Advance Clause Open End Mortgage
Purchase Details
Closed on
Nov 22, 2005
Sold by
Stubbs Jeffery Lynn and Stubbs Tamara Faye
Bought by
Faehling Limbaugh B Jean
Purchase Details
Closed on
Jan 4, 2000
Bought by
Stubbs Jeffery Lynn and Stubbs Tamara F
Purchase Details
Closed on
Mar 12, 1997
Bought by
Sundown Development Corporation
Create a Home Valuation Report for This Property
The Home Valuation Report is an in-depth analysis detailing your home's value as well as a comparison with similar homes in the area
Home Values in the Area
Average Home Value in this Area
Purchase History
| Date | Buyer | Sale Price | Title Company |
|---|---|---|---|
| Esentan Michelle | $194,777 | General Land & Title Svcs | |
| Vista Investments Llc | $170,000 | None Available | |
| Faehling Limbaugh B Jean | $145,800 | -- | |
| Stubbs Jeffery Lynn | $265,000 | -- | |
| Sundown Development Corporation | -- | -- |
Source: Public Records
Mortgage History
| Date | Status | Borrower | Loan Amount |
|---|---|---|---|
| Previous Owner | Vista Investments Llc | $144,500 |
Source: Public Records
Tax History Compared to Growth
Tax History
| Year | Tax Paid | Tax Assessment Tax Assessment Total Assessment is a certain percentage of the fair market value that is determined by local assessors to be the total taxable value of land and additions on the property. | Land | Improvement |
|---|---|---|---|---|
| 2024 | $1,254 | $33,086 | $3,000 | $30,086 |
| 2023 | $1,237 | $33,086 | $3,000 | $30,086 |
| 2022 | $1,184 | $33,086 | $3,000 | $30,086 |
| 2021 | $1,081 | $27,194 | $6,000 | $21,194 |
| 2020 | $1,081 | $27,194 | $6,000 | $21,194 |
| 2019 | $1,081 | $27,194 | $6,000 | $21,194 |
| 2018 | $1,081 | $27,194 | $6,000 | $21,194 |
| 2017 | $1,081 | $27,194 | $6,000 | $21,194 |
| 2016 | $1,358 | $34,519 | $14,000 | $20,519 |
| 2015 | $1,308 | $34,519 | $14,000 | $20,519 |
| 2014 | -- | $34,519 | $14,000 | $20,519 |
Source: Public Records
Map
Nearby Homes
- 10 Old Ford Way
- 22 Winkley Shoals Cove
- 5 Jared Dr
- 9 Jared Dr
- 10 Swinging Bridge Dr
- 2 Swinging Bridge Dr
- Lots 8 and 9 Winkley Shoals Cove Cove N
- 1 Swinging Bridge Dr
- 1100 Wilburn Rd
- 3 Swinging Bridge Dr
- 7 Swinging Bridge Dr
- Lot 27 Oxbow Landing
- Lot 28 Oxbow Landing
- 1520 Wilburn Rd
- 130 River Mountain Dr
- 15 Industrial Park Rd
- 601 River Dr
- 4 Little Red Ln
- 20 Sugarloaf Ln
- 409 River Dr
- 26 Old Ford Way
- 18 Old Ford Way
- 14 Old Ford Way
- 30 Old Ford Way
- 0 Trace Ln
- 34 Old Ford Way
- 38 Old Ford Way
- 6 Old Ford Way
- 50 Trace Ln
- 42 Old Ford Way
- 37 Trace Ln
- 11 Winkley Shoals Trace
- 11 Winkley Shoals Trace
- 11 Winkley Shoals Trace
- 46 Old Ford Way
- 50 Old Ford Way
- 0 Old Ford Way Unit 16025928
- 0 Old Ford Way Unit 20033391
- 0 Old Ford Way Unit 20030969
- 0 Old Ford Way Unit 20025157