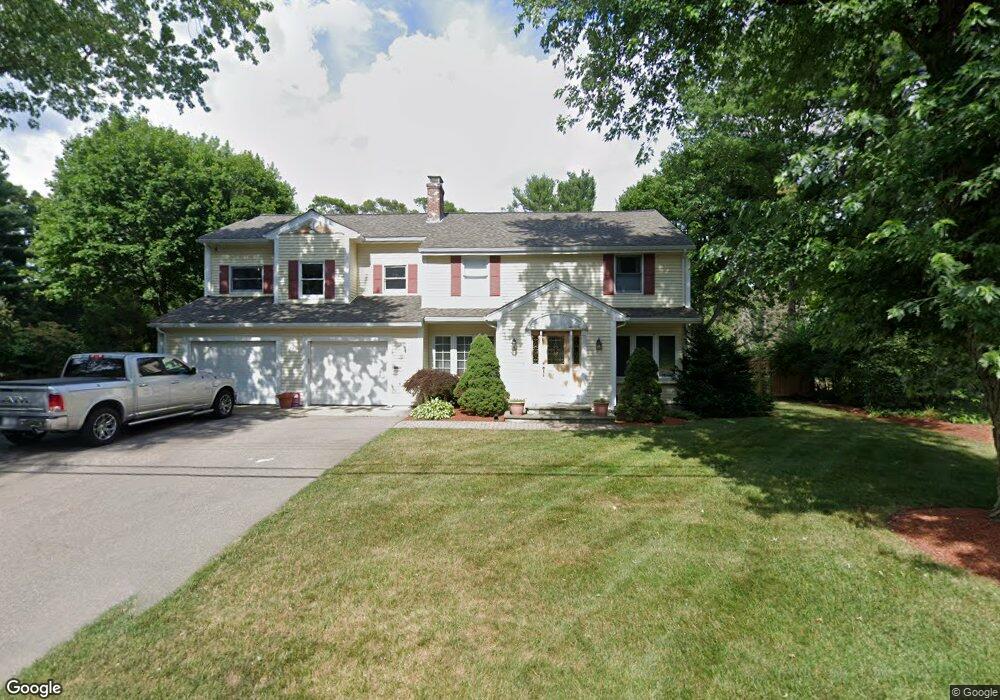
22 Old Tavern Rd Wayland, MA 01778
Estimated Value: $1,113,000 - $1,328,993
3
Beds
2
Baths
3,270
Sq Ft
$372/Sq Ft
Est. Value
About This Home
This home is located at 22 Old Tavern Rd, Wayland, MA 01778 and is currently estimated at $1,216,498, approximately $372 per square foot. 22 Old Tavern Rd is a home located in Middlesex County with nearby schools including Wayland High School, Veritas Christian Academy, and The Rivers School.
Ownership History
Date
Name
Owned For
Owner Type
Purchase Details
Closed on
Dec 15, 2022
Sold by
Rufo Paul A and Rufo Susan M
Bought by
Paul A Rufo Ft and Rufo
Current Estimated Value
Purchase Details
Closed on
Mar 5, 2018
Sold by
Hines Linda F
Bought by
Rufo Paul A and Rufo Susan M
Purchase Details
Closed on
Jan 3, 2018
Sold by
Rufo Paul A and Rufo Susan M
Bought by
Paul A Rufo Ft
Purchase Details
Closed on
Aug 30, 1993
Sold by
Cutter Richard A and Cutter Susanne W
Bought by
Rufo Paul A and Rufo Susan M
Create a Home Valuation Report for This Property
The Home Valuation Report is an in-depth analysis detailing your home's value as well as a comparison with similar homes in the area
Home Values in the Area
Average Home Value in this Area
Purchase History
| Date | Buyer | Sale Price | Title Company |
|---|---|---|---|
| Paul A Rufo Ft | -- | None Available | |
| Paul A Rufo Ft | -- | None Available | |
| Rufo Paul A | -- | -- | |
| Hines Linda F | -- | -- | |
| Paul A Rufo Ft | -- | -- | |
| Hines Linda F | -- | -- | |
| Paul A Rufo Ft | -- | -- | |
| Rufo Paul A | $185,000 | -- |
Source: Public Records
Mortgage History
| Date | Status | Borrower | Loan Amount |
|---|---|---|---|
| Previous Owner | Rufo Paul A | $225,000 | |
| Previous Owner | Rufo Paul A | $200,000 | |
| Previous Owner | Rufo Paul A | $40,000 |
Source: Public Records
Tax History
| Year | Tax Paid | Tax Assessment Tax Assessment Total Assessment is a certain percentage of the fair market value that is determined by local assessors to be the total taxable value of land and additions on the property. | Land | Improvement |
|---|---|---|---|---|
| 2025 | $18,731 | $1,198,400 | $540,800 | $657,600 |
| 2024 | $17,747 | $1,143,500 | $515,100 | $628,400 |
| 2023 | $16,637 | $999,200 | $468,300 | $530,900 |
| 2022 | $16,201 | $882,900 | $387,800 | $495,100 |
| 2021 | $8,395 | $847,600 | $352,500 | $495,100 |
| 2020 | $15,053 | $847,600 | $352,500 | $495,100 |
| 2019 | $14,085 | $770,500 | $310,900 | $459,600 |
| 2018 | $13,319 | $738,700 | $310,900 | $427,800 |
| 2017 | $12,892 | $710,700 | $296,000 | $414,700 |
| 2016 | $11,939 | $688,500 | $290,300 | $398,200 |
| 2015 | $12,119 | $659,000 | $290,300 | $368,700 |
Source: Public Records
Map
Nearby Homes
- 5 Haven Ln
- 201 Willow Brook Dr
- 8 Liberty St
- 340 N Main St
- 6 Brewster Rd
- 186 Main St
- 58 Rice Rd
- 29 Irving Rd
- 6 Briar Ln
- 136 Commonwealth Rd
- 4 Richard Rd
- 45 W Plain St Unit 1
- 1 Richard Rd
- 25 Irving Rd
- 37 Longfellow Rd
- 13 Shawmut Avenue Extension
- 50 Wethersfield Rd
- 278 N Main St
- 16 Arlington Rd
- 5 Griffin Cir
Your Personal Tour Guide
Ask me questions while you tour the home.