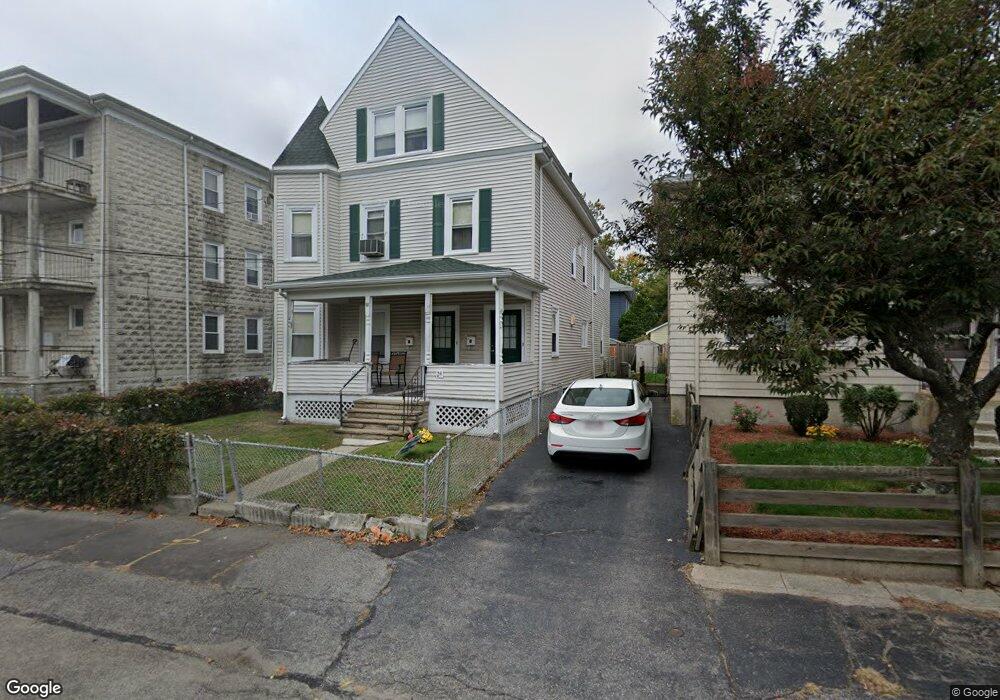
22 Olney St Unit 24 Watertown, MA 02472
West Watertown NeighborhoodEstimated Value: $1,040,000 - $1,191,161
6
Beds
2
Baths
2,726
Sq Ft
$409/Sq Ft
Est. Value
About This Home
This home is located at 22 Olney St Unit 24, Watertown, MA 02472 and is currently estimated at $1,115,540, approximately $409 per square foot. 22 Olney St Unit 24 is a home located in Middlesex County with nearby schools including JCDS, Boston's Jewish Community Day School and Beacon High School.
Ownership History
Date
Name
Owned For
Owner Type
Purchase Details
Closed on
Apr 30, 2025
Sold by
Jtm Ret and Mitchell
Bought by
Olney Holdings Llc
Current Estimated Value
Home Financials for this Owner
Home Financials are based on the most recent Mortgage that was taken out on this home.
Original Mortgage
$1,172,575
Outstanding Balance
$1,168,439
Interest Rate
6.67%
Mortgage Type
Purchase Money Mortgage
Estimated Equity
-$52,899
Purchase Details
Closed on
Feb 16, 2025
Sold by
Mitchell Joseph T
Bought by
Jtm Ret and Mitchell
Purchase Details
Closed on
Mar 17, 1966
Bought by
Mitchell Joseph T and Mitchell Patricia
Create a Home Valuation Report for This Property
The Home Valuation Report is an in-depth analysis detailing your home's value as well as a comparison with similar homes in the area
Home Values in the Area
Average Home Value in this Area
Purchase History
| Date | Buyer | Sale Price | Title Company |
|---|---|---|---|
| Olney Holdings Llc | $1,000,000 | None Available | |
| Olney Holdings Llc | $1,000,000 | None Available | |
| Jtm Ret | -- | None Available | |
| Jtm Ret | -- | None Available | |
| Mitchell Joseph T | -- | -- |
Source: Public Records
Mortgage History
| Date | Status | Borrower | Loan Amount |
|---|---|---|---|
| Open | Olney Holdings Llc | $1,172,575 | |
| Closed | Olney Holdings Llc | $1,172,575 | |
| Previous Owner | Mitchell Joseph T | $130,000 | |
| Previous Owner | Mitchell Joseph T | $121,000 |
Source: Public Records
Tax History Compared to Growth
Tax History
| Year | Tax Paid | Tax Assessment Tax Assessment Total Assessment is a certain percentage of the fair market value that is determined by local assessors to be the total taxable value of land and additions on the property. | Land | Improvement |
|---|---|---|---|---|
| 2025 | $11,237 | $962,100 | $509,400 | $452,700 |
| 2024 | $10,240 | $875,200 | $495,700 | $379,500 |
| 2023 | $11,533 | $849,300 | $474,200 | $375,100 |
| 2022 | $10,726 | $809,500 | $431,100 | $378,400 |
| 2021 | $9,580 | $782,000 | $416,700 | $365,300 |
| 2020 | $9,225 | $759,900 | $402,300 | $357,600 |
| 2019 | $8,990 | $698,000 | $402,300 | $295,700 |
| 2018 | $8,644 | $641,700 | $373,600 | $268,100 |
| 2017 | $8,265 | $595,000 | $326,900 | $268,100 |
| 2016 | $7,893 | $577,000 | $308,900 | $268,100 |
| 2015 | $7,114 | $473,300 | $273,000 | $200,300 |
| 2014 | $6,811 | $455,300 | $255,000 | $200,300 |
Source: Public Records
Map
Nearby Homes
- 94 Lexington St
- 27-29 Edenfield Ave
- 32 Howard St Unit 32
- 109 A Lexington St
- 63 Edenfield Ave
- 5 Chapman St
- 32 Bacon St
- 7 French St
- 11 Midland Rd
- 5 Chatham Way Unit 5
- 79 Waverley Ave Unit 79
- 9 Bancroft St Unit 11
- 38 Carey Ave Unit 3
- 15 Elmwood Ave
- 78 Chestnut St
- 44 Bromfield St
- 12 Cuba St Unit 12
- 172 Westminster Ave Unit 1
- 77 Forest St
- 129 Waverley Ave Unit 129
- 22 Olney St Unit 2
- 22 Olney St
- 26 Olney St
- 20 Olney St
- 20 Olney St Unit 2
- 28 Olney St
- 28 Olney St Unit 1
- 23-25 Purvis St
- 23 Purvis St Unit 25
- 27 Purvis St
- 21 Olney St
- 21 Olney St Unit 1
- 32 Olney St
- 25 Purvis St Unit 1
- 14 Olney St
- 14 Olney St Unit 1
- 19-21 Purvis St
- 19 Purvis St
- 31 Purvis St Unit 33
- 25 Olney St