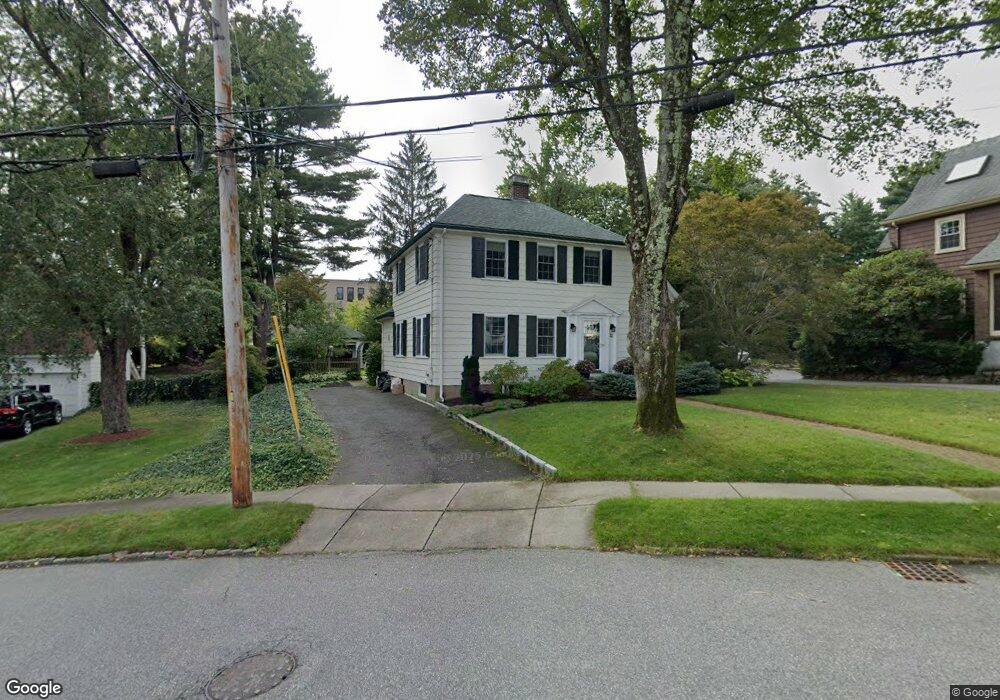
22 Oneida Rd Winchester, MA 01890
West Side NeighborhoodEstimated Value: $1,163,000 - $1,702,000
3
Beds
3
Baths
2,642
Sq Ft
$581/Sq Ft
Est. Value
About This Home
This home is located at 22 Oneida Rd, Winchester, MA 01890 and is currently estimated at $1,533,953, approximately $580 per square foot. 22 Oneida Rd is a home located in Middlesex County with nearby schools including Ambrose Elementary School, McCall Middle School, and Winchester High School.
Ownership History
Date
Name
Owned For
Owner Type
Purchase Details
Closed on
Oct 20, 1995
Sold by
Lamuraglia Glenn and Lamurglia Mary V
Bought by
Wall James M and Corr Jane E
Current Estimated Value
Purchase Details
Closed on
Jul 31, 1989
Sold by
Danielson Lee R
Bought by
Lamuraglia Glenn
Create a Home Valuation Report for This Property
The Home Valuation Report is an in-depth analysis detailing your home's value as well as a comparison with similar homes in the area
Home Values in the Area
Average Home Value in this Area
Purchase History
| Date | Buyer | Sale Price | Title Company |
|---|---|---|---|
| Wall James M | $267,000 | -- | |
| Lamuraglia Glenn | $239,500 | -- |
Source: Public Records
Mortgage History
| Date | Status | Borrower | Loan Amount |
|---|---|---|---|
| Open | Lamuraglia Glenn | $394,000 | |
| Closed | Lamuraglia Glenn | $227,000 |
Source: Public Records
Tax History Compared to Growth
Tax History
| Year | Tax Paid | Tax Assessment Tax Assessment Total Assessment is a certain percentage of the fair market value that is determined by local assessors to be the total taxable value of land and additions on the property. | Land | Improvement |
|---|---|---|---|---|
| 2025 | $161 | $1,448,900 | $903,100 | $545,800 |
| 2024 | $15,243 | $1,345,400 | $838,600 | $506,800 |
| 2023 | $14,214 | $1,204,600 | $709,600 | $495,000 |
| 2022 | $14,345 | $1,146,700 | $677,300 | $469,400 |
| 2021 | $0 | $1,017,700 | $548,300 | $469,400 |
| 2020 | $12,210 | $985,500 | $516,100 | $469,400 |
| 2019 | $11,543 | $953,200 | $483,800 | $469,400 |
| 2018 | $11,248 | $922,700 | $466,100 | $456,600 |
| 2017 | $10,029 | $816,700 | $415,300 | $401,400 |
| 2016 | $9,400 | $804,800 | $415,300 | $389,500 |
| 2015 | $8,764 | $721,900 | $346,700 | $375,200 |
| 2014 | $8,989 | $710,000 | $346,700 | $363,300 |
Source: Public Records
Map
Nearby Homes