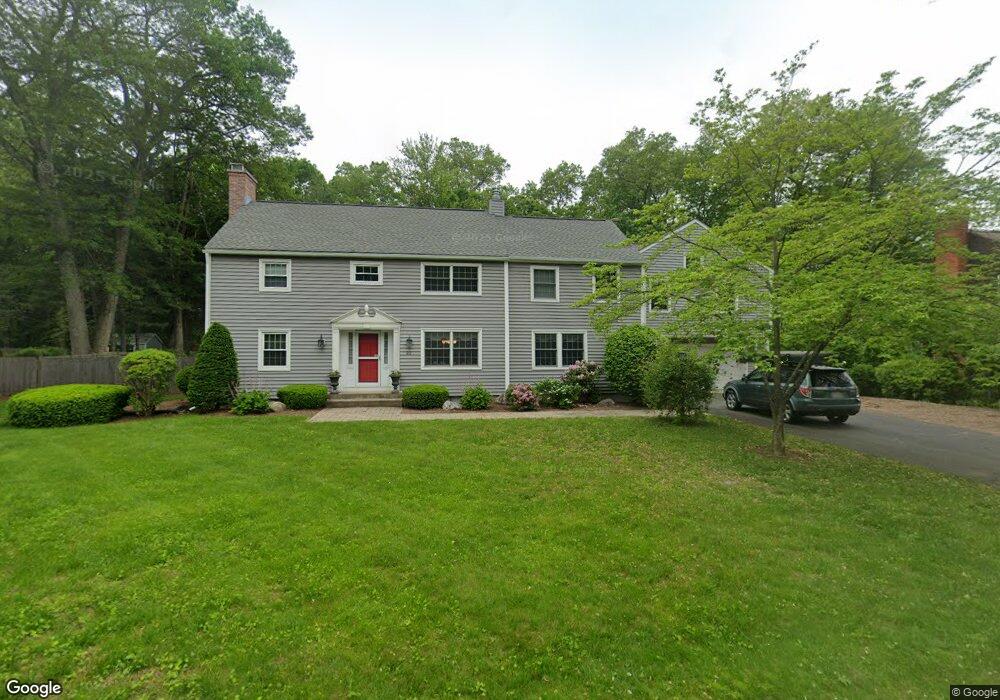
22 Overlook Dr Westfield, MA 01085
Estimated Value: $554,446 - $573,000
4
Beds
4
Baths
3,019
Sq Ft
$186/Sq Ft
Est. Value
About This Home
This home is located at 22 Overlook Dr, Westfield, MA 01085 and is currently estimated at $562,362, approximately $186 per square foot. 22 Overlook Dr is a home located in Hampden County with nearby schools including Westfield High School and Saint Mary High School.
Ownership History
Date
Name
Owned For
Owner Type
Purchase Details
Closed on
Sep 28, 2007
Sold by
Bacon Andrea L and Bacon Robert J
Bought by
Clark J Scott and Clark Laurie A
Current Estimated Value
Purchase Details
Closed on
Oct 30, 1995
Sold by
Mccullagh Charles B and Mccullagh Martha S
Bought by
Bacon Robert J
Home Financials for this Owner
Home Financials are based on the most recent Mortgage that was taken out on this home.
Original Mortgage
$113,850
Interest Rate
7.6%
Mortgage Type
Purchase Money Mortgage
Purchase Details
Closed on
Jan 28, 1992
Sold by
Walter Gilmore A
Bought by
Mccullagh Charles B and Mccullagh Martha
Home Financials for this Owner
Home Financials are based on the most recent Mortgage that was taken out on this home.
Original Mortgage
$144,000
Interest Rate
8.45%
Mortgage Type
Purchase Money Mortgage
Create a Home Valuation Report for This Property
The Home Valuation Report is an in-depth analysis detailing your home's value as well as a comparison with similar homes in the area
Home Values in the Area
Average Home Value in this Area
Purchase History
| Date | Buyer | Sale Price | Title Company |
|---|---|---|---|
| Clark J Scott | $400,000 | -- | |
| Bacon Robert J | $165,000 | -- | |
| Mccullagh Charles B | $180,000 | -- |
Source: Public Records
Mortgage History
| Date | Status | Borrower | Loan Amount |
|---|---|---|---|
| Previous Owner | Mccullagh Charles B | $183,000 | |
| Previous Owner | Mccullagh Charles B | $113,850 | |
| Previous Owner | Mccullagh Charles B | $144,000 |
Source: Public Records
Tax History Compared to Growth
Tax History
| Year | Tax Paid | Tax Assessment Tax Assessment Total Assessment is a certain percentage of the fair market value that is determined by local assessors to be the total taxable value of land and additions on the property. | Land | Improvement |
|---|---|---|---|---|
| 2025 | $6,884 | $453,500 | $138,600 | $314,900 |
| 2024 | $6,909 | $432,600 | $126,000 | $306,600 |
| 2023 | $6,678 | $390,400 | $120,100 | $270,300 |
| 2022 | $6,405 | $346,400 | $107,300 | $239,100 |
| 2021 | $3,005 | $328,900 | $101,000 | $227,900 |
| 2020 | $6,010 | $312,200 | $101,000 | $211,200 |
| 2019 | $5,879 | $298,900 | $96,100 | $202,800 |
| 2018 | $5,787 | $298,900 | $96,100 | $202,800 |
| 2017 | $5,676 | $292,300 | $97,800 | $194,500 |
| 2016 | $5,682 | $292,300 | $97,800 | $194,500 |
| 2015 | $5,212 | $281,100 | $97,800 | $183,300 |
| 2014 | $3,900 | $281,100 | $97,800 | $183,300 |
Source: Public Records
Map
Nearby Homes
- 555 Russell Rd Unit D18
- 549 Russell Rd Unit 6B
- 40 Heritage Ln
- 324 Russell Rd Unit 204
- 508 Granville Rd
- 110 Kensington Ave
- 205 Russell Rd
- 11 Highland Cir
- 53 Yankee Cir
- 0 Fox Hill Dr
- 291 Pochassic Rd
- 78 Granville Rd Unit 11
- 197 Loomis Rg
- 148 Prospect Street Extension
- 128 Crane Ave
- 3 Angelica Dr
- 113 Franklin St
- 8 Ellis St
- 13 King Place
- 172 Valley View Dr