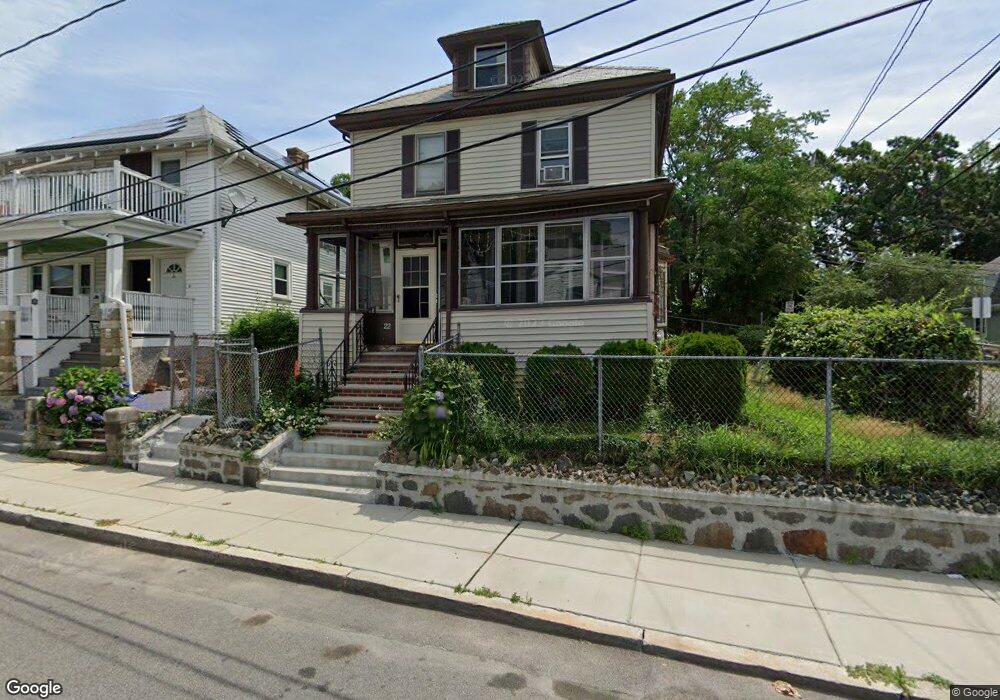
22 Owen St Mattapan, MA 02126
Southern Mattapan NeighborhoodEstimated Value: $586,000 - $689,000
3
Beds
2
Baths
1,476
Sq Ft
$430/Sq Ft
Est. Value
About This Home
This home is located at 22 Owen St, Mattapan, MA 02126 and is currently estimated at $635,105, approximately $430 per square foot. 22 Owen St is a home located in Suffolk County with nearby schools including Berea Seventh-day Adventist Academy.
Ownership History
Date
Name
Owned For
Owner Type
Purchase Details
Closed on
Jun 19, 1995
Sold by
Jones Doris L
Bought by
Seymour Allen Maxine and Seymour Allen
Current Estimated Value
Home Financials for this Owner
Home Financials are based on the most recent Mortgage that was taken out on this home.
Original Mortgage
$107,825
Interest Rate
8.24%
Mortgage Type
Purchase Money Mortgage
Create a Home Valuation Report for This Property
The Home Valuation Report is an in-depth analysis detailing your home's value as well as a comparison with similar homes in the area
Home Values in the Area
Average Home Value in this Area
Purchase History
| Date | Buyer | Sale Price | Title Company |
|---|---|---|---|
| Seymour Allen Maxine | $113,500 | -- |
Source: Public Records
Mortgage History
| Date | Status | Borrower | Loan Amount |
|---|---|---|---|
| Open | Seymour Allen Maxine | $103,000 | |
| Closed | Seymour Allen Maxine | $107,825 |
Source: Public Records
Tax History Compared to Growth
Tax History
| Year | Tax Paid | Tax Assessment Tax Assessment Total Assessment is a certain percentage of the fair market value that is determined by local assessors to be the total taxable value of land and additions on the property. | Land | Improvement |
|---|---|---|---|---|
| 2025 | $5,958 | $514,500 | $130,600 | $383,900 |
| 2024 | $5,193 | $476,400 | $157,900 | $318,500 |
| 2023 | $4,873 | $453,700 | $150,400 | $303,300 |
| 2022 | $4,658 | $428,100 | $141,900 | $286,200 |
| 2021 | $4,432 | $415,400 | $141,900 | $273,500 |
| 2020 | $3,880 | $367,400 | $123,700 | $243,700 |
| 2019 | $3,618 | $343,300 | $93,000 | $250,300 |
| 2018 | $3,364 | $321,000 | $93,000 | $228,000 |
| 2017 | $3,364 | $317,700 | $93,000 | $224,700 |
| 2016 | $3,038 | $276,200 | $93,000 | $183,200 |
| 2015 | $2,457 | $202,900 | $75,200 | $127,700 |
| 2014 | $2,383 | $189,400 | $75,200 | $114,200 |
Source: Public Records
Map
Nearby Homes
- 124 Selden St
- 139 Selden St
- 15-17 W Selden St
- 808 Morton St Unit 3
- 30 Glenhill Rd
- 32 Crowell St
- 18 Astoria St
- 147 Fairmount St
- 44 Evans St
- 23 Maryknoll St
- 73 Stanton St
- 68 Mascot St
- 251 Norfolk St Unit A
- 10 Sutton St
- 84-86 Codman Hill Ave
- 5 Sutton St
- 5 Sutton St Unit 3B
- 64 Stockton St
- 81 Mora St
- 183 Fuller St Unit 1