22 Pequod Ln Eastham, MA 02642
Estimated Value: $704,000 - $750,112
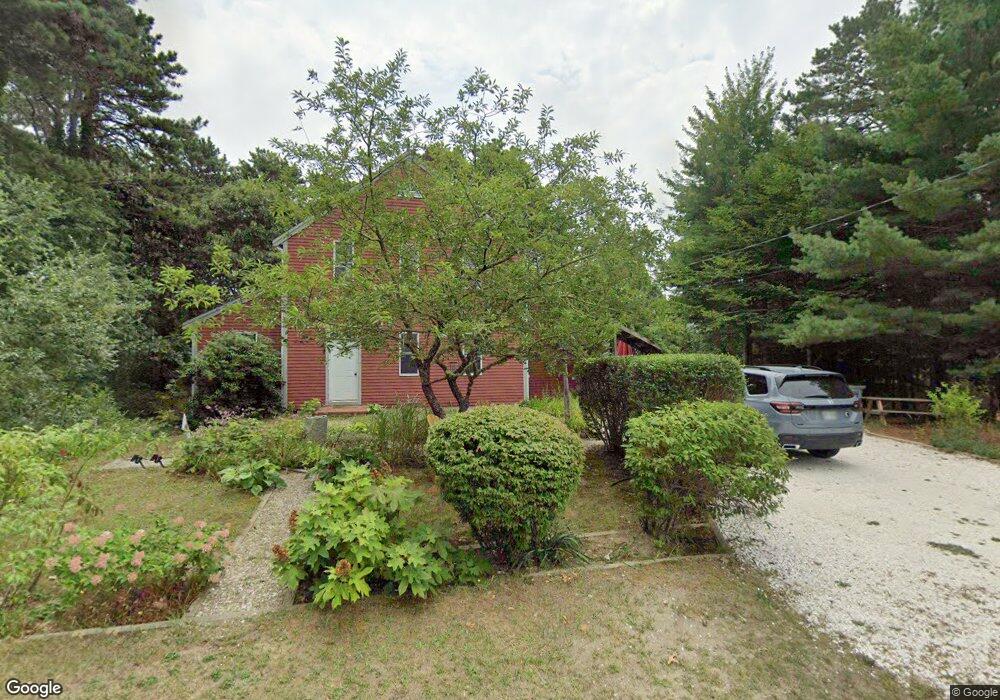
About This Home
This home is located at 22 Pequod Ln, Eastham, MA 02642 and is currently estimated at $733,028, approximately $532 per square foot. 22 Pequod Ln is a home located in Barnstable County with nearby schools including Eastham Elementary School, Nauset Regional Middle School, and Nauset Regional High School.
Ownership History
We collect this data history from publicly available records. To have your information removed, we recommend requesting removal directly through your county’s website.
Purchase Details
Home Financials for this Owner
Home Financials are based on the most recent Mortgage that was taken out on this home.Home Values in the Area
Average Home Value in this Area
Purchase History
We collect this data history from publicly available records. To have your information removed, we recommend requesting removal directly through your county’s website.
| Date | Buyer | Sale Price | Title Company |
|---|---|---|---|
| $140,000 | -- | ||
| $140,000 | -- |
Mortgage History
We collect this data history from publicly available records. To have your information removed, we recommend requesting removal directly through your county’s website.
| Date | Status | Borrower | Loan Amount |
|---|---|---|---|
| Open | $133,000 | ||
| Closed | $133,000 |
Tax History
We collect this data history from publicly available records. To have your information removed, we recommend requesting removal directly through your county’s website.
| Year | Tax Paid | Tax Assessment Tax Assessment Total Assessment is a certain percentage of the fair market value that is determined by local assessors to be the total taxable value of land and additions on the property. | Land | Improvement |
|---|---|---|---|---|
| 2025 | $4,971 | $644,800 | $264,300 | $380,500 |
| 2024 | $4,352 | $620,800 | $256,600 | $364,200 |
| 2023 | $4,046 | $558,800 | $237,600 | $321,200 |
| 2022 | $3,801 | $443,000 | $212,200 | $230,800 |
| 2021 | $3,696 | $402,600 | $192,800 | $209,800 |
| 2020 | $3,450 | $395,600 | $196,800 | $198,800 |
| 2019 | $3,170 | $384,200 | $191,100 | $193,100 |
| 2018 | $3,135 | $375,500 | $185,500 | $190,000 |
| 2017 | $2,908 | $368,100 | $181,900 | $186,200 |
| 2016 | $2,766 | $371,800 | $181,900 | $189,900 |
| 2015 | $2,543 | $358,200 | $178,300 | $179,900 |
Map
- 435 Herring Brook Rd
- 20 Stone Ct
- 655 Herring Brook Rd
- 1975 State Hwy Unit 1
- 1975 State Hwy Unit 9
- 12 Settlers Trace
- 35 Sands Rd
- 1061 State Hwy Unit 4
- 1061 State Hwy Unit 1061
- 205 S Eastham St
- 785 State Hwy Unit 9
- 163 Samoset Rd
- 20 Priscilla Cir
- 60 Smith Heights Way
- 20 Kittiwake Ln
- 40 Kittiwake Ln
- 65 Pilgrims Path
- 10 Polly Seabury Way
- 21 Locust Rd
- 40 Bayview Rd
Ask me questions while you tour the home.