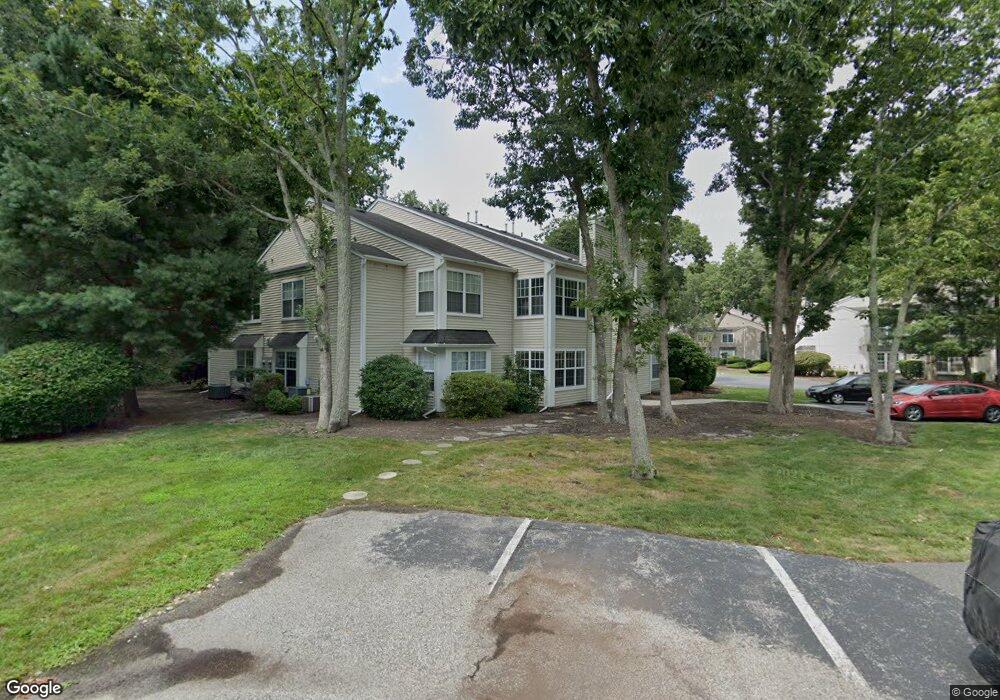
22 Pheasant Meadow Dr Galloway, NJ 08205
Estimated Value: $216,000 - $241,000
2
Beds
2
Baths
1,032
Sq Ft
$224/Sq Ft
Est. Value
About This Home
This home is located at 22 Pheasant Meadow Dr, Galloway, NJ 08205 and is currently estimated at $230,917, approximately $223 per square foot. 22 Pheasant Meadow Dr is a home located in Atlantic County with nearby schools including Cedar Creek High School, Oakcrest High School, and Atlantic Community Charter School.
Ownership History
Date
Name
Owned For
Owner Type
Purchase Details
Closed on
Mar 24, 2024
Sold by
Mercer Erin
Bought by
Mercer Erin
Current Estimated Value
Purchase Details
Closed on
Feb 12, 2018
Sold by
Kull Geralyn and Strike Geralyn
Bought by
Mercer Erin and Mercer Ernest A
Home Financials for this Owner
Home Financials are based on the most recent Mortgage that was taken out on this home.
Original Mortgage
$73,865
Interest Rate
3.99%
Mortgage Type
New Conventional
Purchase Details
Closed on
Jan 2, 2015
Sold by
Estate Of Joseph V Strike Jr
Bought by
Strike Geralyn and Hernandez Adrian
Purchase Details
Closed on
May 16, 2012
Sold by
Phillips Richard A and Phillips Revocable T Richard A
Bought by
Strike Joseph V
Purchase Details
Closed on
Aug 11, 2010
Sold by
Phillips Richard A
Bought by
Phillips Richard A and The Richard A Phillips Revocab
Create a Home Valuation Report for This Property
The Home Valuation Report is an in-depth analysis detailing your home's value as well as a comparison with similar homes in the area
Home Values in the Area
Average Home Value in this Area
Purchase History
| Date | Buyer | Sale Price | Title Company |
|---|---|---|---|
| Mercer Erin | -- | None Listed On Document | |
| Mercer Erin | $86,900 | The Title Co Of Jersey | |
| Strike Geralyn | -- | None Available | |
| Strike Joseph V | $92,500 | Foundation Title Llc Linwood | |
| Phillips Richard A | -- | None Available |
Source: Public Records
Mortgage History
| Date | Status | Borrower | Loan Amount |
|---|---|---|---|
| Previous Owner | Mercer Erin | $73,865 |
Source: Public Records
Tax History Compared to Growth
Tax History
| Year | Tax Paid | Tax Assessment Tax Assessment Total Assessment is a certain percentage of the fair market value that is determined by local assessors to be the total taxable value of land and additions on the property. | Land | Improvement |
|---|---|---|---|---|
| 2025 | $3,478 | $104,200 | $40,000 | $64,200 |
| 2024 | $3,478 | $104,200 | $40,000 | $64,200 |
| 2023 | $3,346 | $104,200 | $40,000 | $64,200 |
| 2022 | $3,346 | $104,200 | $40,000 | $64,200 |
| 2021 | $3,279 | $104,200 | $40,000 | $64,200 |
| 2020 | $3,227 | $104,200 | $40,000 | $64,200 |
| 2019 | $3,168 | $104,200 | $40,000 | $64,200 |
| 2018 | $3,212 | $104,200 | $40,000 | $64,200 |
| 2017 | $3,212 | $104,200 | $40,000 | $64,200 |
| 2016 | $3,184 | $104,200 | $40,000 | $64,200 |
| 2015 | $3,170 | $104,200 | $40,000 | $64,200 |
| 2014 | $3,065 | $104,200 | $40,000 | $64,200 |
Source: Public Records
Map
Nearby Homes
- 25 Pheasant Meadow Dr
- 32 Pheasant Meadow Dr Unit S
- 39 Pheasant Meadow Dr
- 718 Cardinal Way
- 56 Pheasant Meadow Dr
- 91 Pheasant Meadow Dr Unit 6
- 700 Osprey Ct
- 85 Waterview Dr
- 103 S Edgewater Dr Unit 103
- 705 E Grist Mill Way
- 18 N Grist Mill Place
- 710 Whalers Cove Ct
- 722 E Grist Mill Way
- 81 Trotters Ln
- 44 Trotters Ln Unit 1007
- 685 E Lake Front Cir Unit 81
- 732 Whalers Cove Ct
- 00 Chestnut & Roosevelt St
- 710 Moonraker Ct
- 704 Moonraker Ct
- 26 Pheasant Meadow Dr Unit 5
- 22 Pheasant Meadow Dr
- 24 Pheasant Meadow Dr
- 18 Pheasant Meadow Dr
- 18 Pheasant Meadow Dr Unit 18
- 20 Pheasant Meadow Dr Unit 2
- 20 Pheasant Meadow Dr Unit 18/32
- 30 Pheasant Meadow Dr Unit 7
- 28 Pheasant Meadow Dr
- 28 Pheasant Meadow Dr Unit 106
- 27 Pheasant Meadow Dr
- 27 Pheasant Meadow Dr
- 2 Pheasant Meadow Dr
- 17 Pheasant Meadow Dr Unit 1
- 31 Pheasant Meadow Dr Unit 8
- 16 Pheasant Meadow Dr
- 8 Pheasant Meadow Dr
- 21 Pheasant Meadow Dr Unit 3
- 717 Cardinal Way
- 29 Pheasant Meadow Dr Unit 7