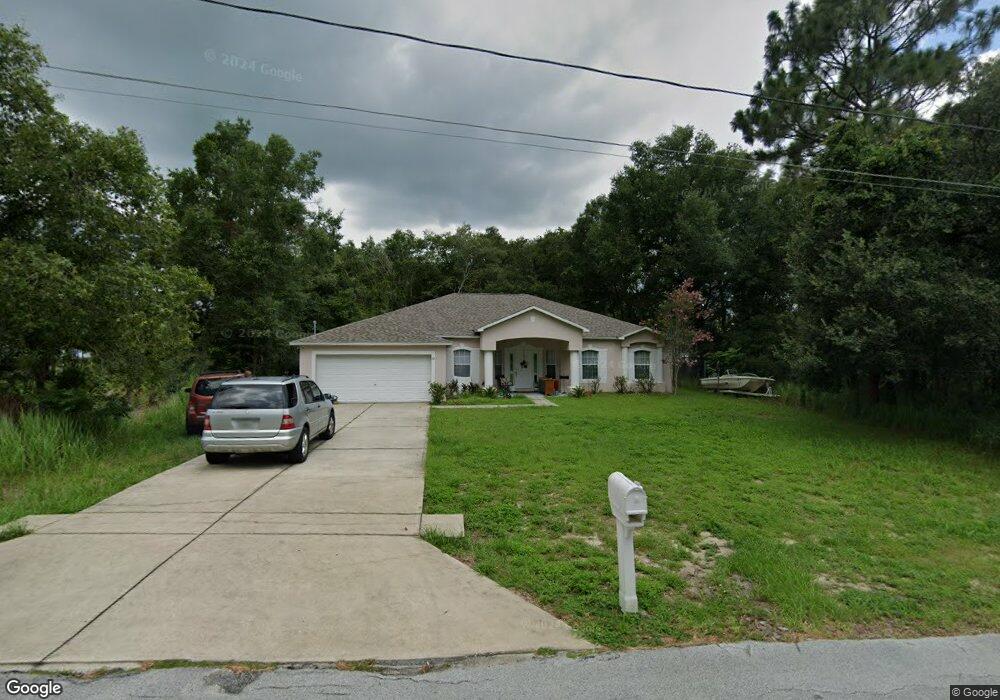
22 Pine Course Trace Ocala, FL 34472
Silver Spring Shores NeighborhoodEstimated Value: $276,000 - $348,000
4
Beds
3
Baths
2,225
Sq Ft
$140/Sq Ft
Est. Value
About This Home
This home is located at 22 Pine Course Trace, Ocala, FL 34472 and is currently estimated at $311,688, approximately $140 per square foot. 22 Pine Course Trace is a home located in Marion County with nearby schools including Legacy Elementary School, Lake Weir Middle School, and Forest High School.
Ownership History
Date
Name
Owned For
Owner Type
Purchase Details
Closed on
May 15, 2009
Sold by
Schultz John Laurence and Avella Rosa Adlin
Bought by
Byfield Shavonne
Current Estimated Value
Home Financials for this Owner
Home Financials are based on the most recent Mortgage that was taken out on this home.
Original Mortgage
$129,222
Outstanding Balance
$80,409
Interest Rate
4.81%
Mortgage Type
FHA
Estimated Equity
$231,279
Purchase Details
Closed on
Jul 21, 2006
Sold by
Holiday Builders Inc
Bought by
Schultz John Laurence and Avella Rosa Adlin
Home Financials for this Owner
Home Financials are based on the most recent Mortgage that was taken out on this home.
Original Mortgage
$210,600
Interest Rate
10.12%
Mortgage Type
Purchase Money Mortgage
Purchase Details
Closed on
Jan 13, 2006
Sold by
Sblc Llc
Bought by
Holiday Builders Inc
Purchase Details
Closed on
Sep 2, 2005
Sold by
Whilby Janette
Bought by
Sbsg Llc
Create a Home Valuation Report for This Property
The Home Valuation Report is an in-depth analysis detailing your home's value as well as a comparison with similar homes in the area
Home Values in the Area
Average Home Value in this Area
Purchase History
| Date | Buyer | Sale Price | Title Company |
|---|---|---|---|
| Byfield Shavonne | $135,000 | Premier Title Partners Of Oc | |
| Schultz John Laurence | $234,100 | Hbi Title Company | |
| Holiday Builders Inc | $54,000 | Hbi Title Company | |
| Sblc Llc | -- | Union Title Services Inc | |
| Sbsg Llc | $25,000 | Union Title Services Inc |
Source: Public Records
Mortgage History
| Date | Status | Borrower | Loan Amount |
|---|---|---|---|
| Open | Byfield Shavonne | $129,222 | |
| Previous Owner | Schultz John Laurence | $210,600 |
Source: Public Records
Tax History
| Year | Tax Paid | Tax Assessment Tax Assessment Total Assessment is a certain percentage of the fair market value that is determined by local assessors to be the total taxable value of land and additions on the property. | Land | Improvement |
|---|---|---|---|---|
| 2025 | $4,644 | $261,358 | -- | -- |
| 2024 | $4,393 | $237,598 | -- | -- |
| 2023 | $4,138 | $215,998 | $0 | $0 |
| 2022 | $3,762 | $196,362 | $0 | $0 |
| 2021 | $3,312 | $183,929 | $8,000 | $175,929 |
| 2020 | $3,029 | $162,283 | $7,500 | $154,783 |
| 2019 | $3,005 | $159,862 | $7,500 | $152,362 |
| 2018 | $2,715 | $151,895 | $5,500 | $146,395 |
| 2017 | $2,583 | $148,040 | $4,000 | $144,040 |
| 2016 | $2,348 | $119,073 | $0 | $0 |
| 2015 | $2,116 | $108,248 | $0 | $0 |
| 2014 | $1,975 | $105,163 | $0 | $0 |
Source: Public Records
Map
Nearby Homes
- 0 Pine Course Trace
- 31 Dogwood Drive Ln
- 7 Willow Rd
- 14 Pine Course Pass
- 178 Pine Course
- 42 Dogwood Drive Course
- 124 Pine Course
- 34 Dogwood Drive Course
- 24 Pine Course Pass
- 1 Dogwood Drive Course
- 5 Pine Track Place
- 18 Pine Course Loop
- 0 Dogwood Drive Course
- 67 Dogwood Drive Pass
- 79 Willow Rd
- 34 Pine Course Pass
- 2 Pine Track Terrace
- 0 Dogwood Loop Ct Unit MFRO6379261
- 60 Dogwood Drive Pass
- 5 Dogwood Dr
- 18 Pine Course Trace
- 12 Pine Course Radial
- 8 Pine Course Radial
- 19 Pine Course Trace
- 33 Willow Rd
- 14 Pine Course Radial
- 9 Pine Course Radial
- 35 Willow Rd
- 45 Willow Rd
- 47 Willow Rd
- 11 Pine Course Radial
- 6 Pine Course Radial
- 37 Willow Rd
- 17 Pine Course Trace
- 0 (TBD) Pine Course Radial
- 7 Pine Course Radial
- 16 Pine Course Trace
- LOT 18 Pine Course Radial
- TBD SW Willow Rd
- 27 Willow Rd
Your Personal Tour Guide
Ask me questions while you tour the home.