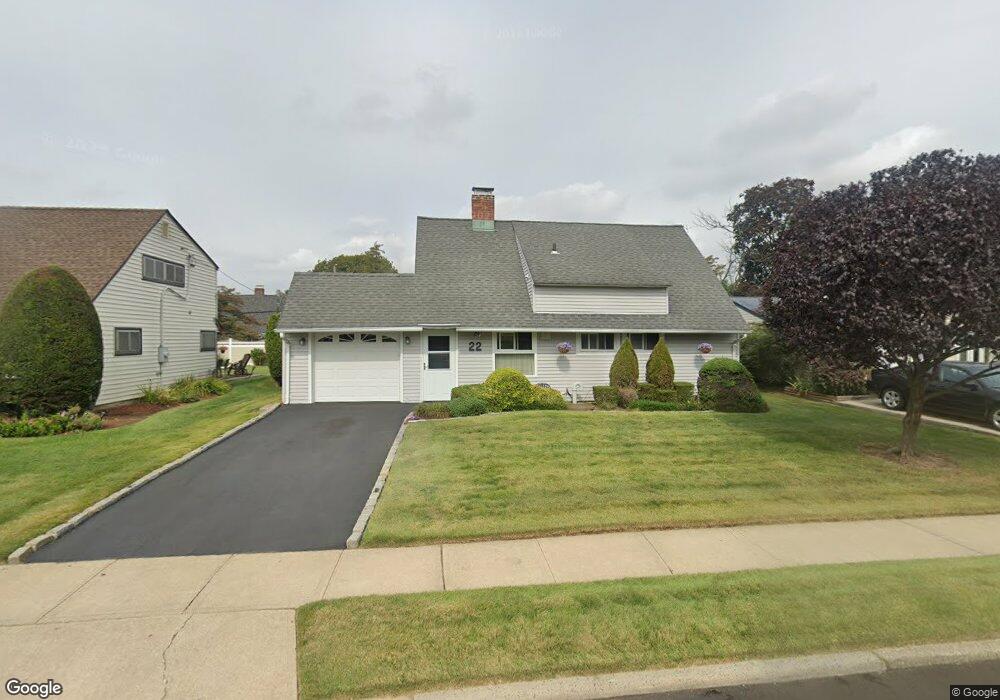
22 Pinecone Ln Westbury, NY 11590
Estimated Value: $677,241
--
Bed
1
Bath
1,290
Sq Ft
$525/Sq Ft
Est. Value
About This Home
This home is located at 22 Pinecone Ln, Westbury, NY 11590 and is currently estimated at $677,241, approximately $524 per square foot. 22 Pinecone Ln is a home located in Nassau County with nearby schools including Bowling Green Elementary School, Clarke Middle School, and Carousel Day School.
Ownership History
Date
Name
Owned For
Owner Type
Purchase Details
Closed on
Dec 31, 2021
Sold by
Epaminonde Diane and Epaminonde Jane
Bought by
Epaminonde Diane
Current Estimated Value
Home Financials for this Owner
Home Financials are based on the most recent Mortgage that was taken out on this home.
Original Mortgage
$862,500
Outstanding Balance
$795,936
Interest Rate
3.21%
Mortgage Type
Reverse Mortgage Home Equity Conversion Mortgage
Estimated Equity
-$118,695
Purchase Details
Closed on
May 16, 2014
Sold by
Gilmartin Joann
Bought by
Epaminonde Diane and Santiago Diane
Purchase Details
Closed on
Sep 19, 2005
Sold by
Santiago Diane
Create a Home Valuation Report for This Property
The Home Valuation Report is an in-depth analysis detailing your home's value as well as a comparison with similar homes in the area
Home Values in the Area
Average Home Value in this Area
Purchase History
| Date | Buyer | Sale Price | Title Company |
|---|---|---|---|
| Epaminonde Diane | -- | Judicial Title | |
| Epaminonde Diane | $95,000 | Westcor Land Title | |
| -- | -- | -- | |
| -- | -- | -- |
Source: Public Records
Mortgage History
| Date | Status | Borrower | Loan Amount |
|---|---|---|---|
| Open | Epaminonde Diane | $862,500 |
Source: Public Records
Tax History Compared to Growth
Tax History
| Year | Tax Paid | Tax Assessment Tax Assessment Total Assessment is a certain percentage of the fair market value that is determined by local assessors to be the total taxable value of land and additions on the property. | Land | Improvement |
|---|---|---|---|---|
| 2025 | $8,035 | $417 | $233 | $184 |
| 2024 | $3,221 | $416 | $232 | $184 |
| 2023 | $8,523 | $437 | $244 | $193 |
| 2022 | $8,523 | $437 | $244 | $193 |
| 2021 | $10,664 | $441 | $247 | $194 |
| 2020 | $7,898 | $465 | $464 | $1 |
| 2019 | $6,787 | $499 | $498 | $1 |
| 2018 | $7,024 | $532 | $0 | $0 |
| 2017 | $4,348 | $565 | $463 | $102 |
| 2016 | $7,290 | $598 | $490 | $108 |
| 2015 | $3,049 | $726 | $595 | $131 |
| 2014 | $3,049 | $726 | $595 | $131 |
| 2013 | $2,403 | $726 | $595 | $131 |
Source: Public Records
Map
Nearby Homes