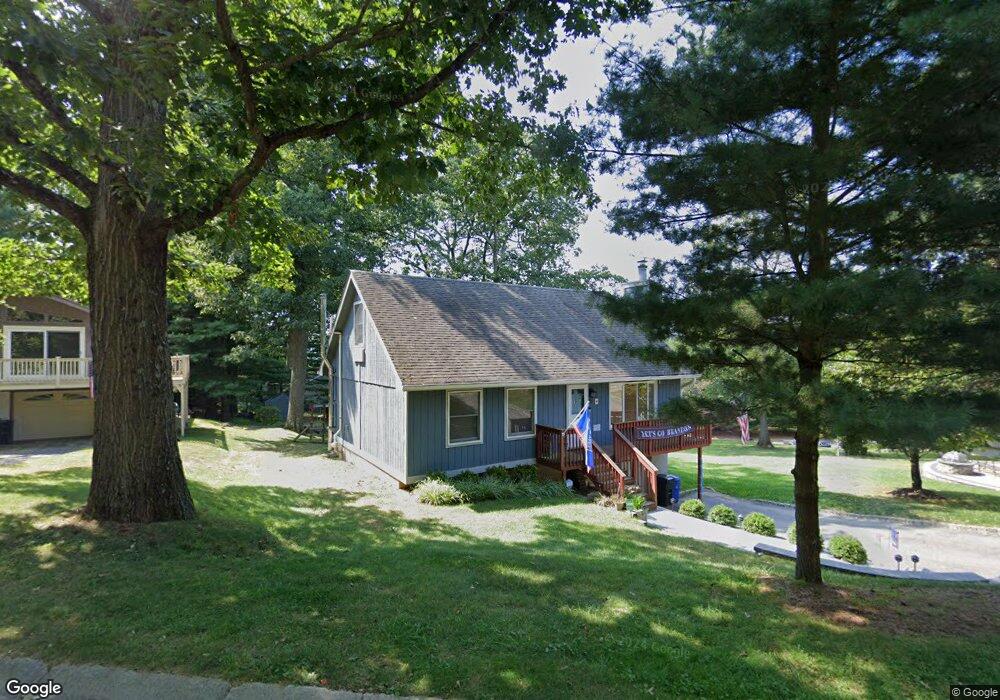
22 Pleasant Rd High Bridge, NJ 08829
Estimated Value: $323,000 - $398,000
Studio
--
Bath
1,456
Sq Ft
$252/Sq Ft
Est. Value
About This Home
This home is located at 22 Pleasant Rd, High Bridge, NJ 08829 and is currently estimated at $367,019, approximately $252 per square foot. 22 Pleasant Rd is a home located in Hunterdon County with nearby schools including High Bridge Elementary School, High Bridge Middle School, and Voorhees High School.
Ownership History
Date
Name
Owned For
Owner Type
Purchase Details
Closed on
Oct 20, 2000
Sold by
Rosa Timothy
Bought by
Poles Robert E and Moynihan Colleen L
Current Estimated Value
Home Financials for this Owner
Home Financials are based on the most recent Mortgage that was taken out on this home.
Original Mortgage
$162,450
Outstanding Balance
$55,676
Interest Rate
7.83%
Mortgage Type
FHA
Estimated Equity
$311,343
Purchase Details
Closed on
Sep 25, 1995
Sold by
Steinbach Robert F and Steinbach Ok Son
Bought by
Rosa Timothy and Carbone Ginamarie
Create a Home Valuation Report for This Property
The Home Valuation Report is an in-depth analysis detailing your home's value as well as a comparison with similar homes in the area
Home Values in the Area
Average Home Value in this Area
Purchase History
| Date | Buyer | Sale Price | Title Company |
|---|---|---|---|
| Poles Robert E | $167,500 | -- | |
| Rosa Timothy | $130,000 | -- |
Source: Public Records
Mortgage History
| Date | Status | Borrower | Loan Amount |
|---|---|---|---|
| Open | Poles Robert E | $162,450 |
Source: Public Records
Tax History
| Year | Tax Paid | Tax Assessment Tax Assessment Total Assessment is a certain percentage of the fair market value that is determined by local assessors to be the total taxable value of land and additions on the property. | Land | Improvement |
|---|---|---|---|---|
| 2025 | $10,974 | $332,300 | $163,800 | $168,500 |
| 2024 | $8,758 | $336,200 | $94,600 | $241,600 |
| 2023 | $8,758 | $221,500 | $74,800 | $146,700 |
| 2022 | $9,246 | $217,300 | $69,800 | $147,500 |
| 2021 | $9,060 | $217,000 | $69,800 | $147,200 |
| 2020 | $8,889 | $216,800 | $70,000 | $146,800 |
| 2019 | $8,857 | $214,400 | $66,800 | $147,600 |
| 2018 | $8,485 | $214,100 | $65,600 | $148,500 |
| 2017 | $8,471 | $219,800 | $68,800 | $151,000 |
| 2016 | $8,246 | $216,500 | $68,800 | $147,700 |
| 2015 | $8,023 | $216,500 | $68,800 | $147,700 |
| 2014 | $7,009 | $204,400 | $113,000 | $91,400 |
Source: Public Records
Map
Nearby Homes
Your Personal Tour Guide
Ask me questions while you tour the home.