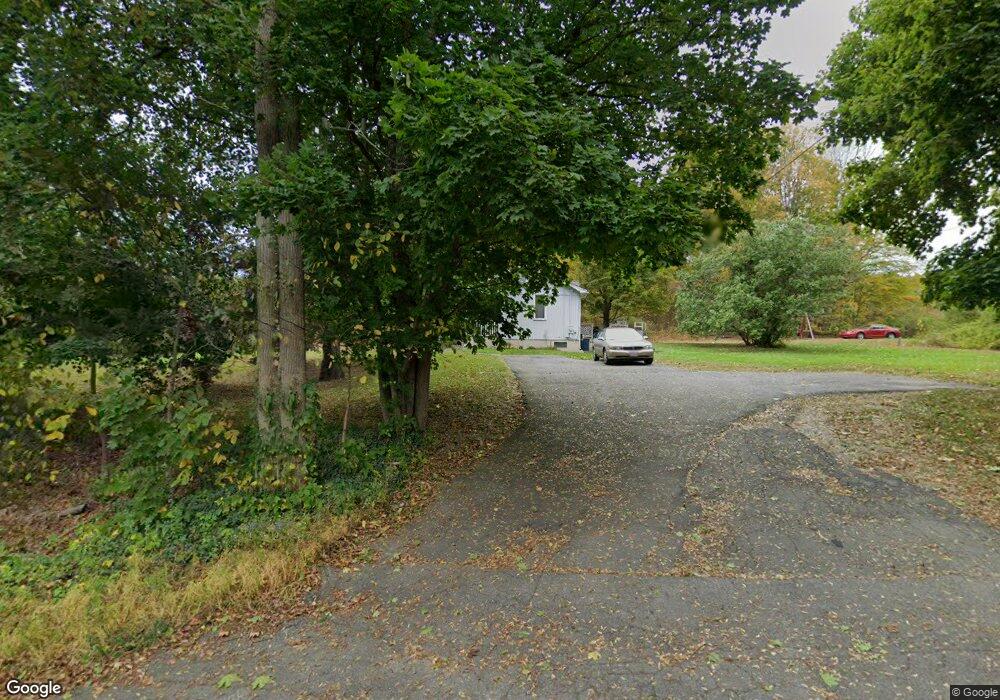
22 Ponakin Rd Lancaster, MA 01523
Estimated Value: $520,000 - $558,476
3
Beds
2
Baths
1,320
Sq Ft
$405/Sq Ft
Est. Value
About This Home
This home is located at 22 Ponakin Rd, Lancaster, MA 01523 and is currently estimated at $534,869, approximately $405 per square foot. 22 Ponakin Rd is a home located in Worcester County with nearby schools including Mary Rowlandson Elementary School, Luther Burbank Middle School, and Nashoba Regional High School.
Ownership History
Date
Name
Owned For
Owner Type
Purchase Details
Closed on
Dec 28, 2017
Sold by
Freedman Harvey L and Tate Pamela K
Bought by
Rowe Pamela
Current Estimated Value
Home Financials for this Owner
Home Financials are based on the most recent Mortgage that was taken out on this home.
Original Mortgage
$287,693
Outstanding Balance
$196,895
Interest Rate
3.99%
Mortgage Type
FHA
Estimated Equity
$337,974
Purchase Details
Closed on
Apr 6, 2015
Sold by
Rowe Pamela and Freedman Harvey L
Bought by
Freedman Harvey L
Purchase Details
Closed on
Jul 30, 2009
Sold by
Freedman Harvey L
Bought by
Freedman Harvey L and Rowe Pamela
Purchase Details
Closed on
Apr 25, 2006
Sold by
Day Bryan W and Day Linda L
Bought by
Freedman Harvey L
Home Financials for this Owner
Home Financials are based on the most recent Mortgage that was taken out on this home.
Original Mortgage
$273,600
Interest Rate
6.37%
Mortgage Type
Purchase Money Mortgage
Create a Home Valuation Report for This Property
The Home Valuation Report is an in-depth analysis detailing your home's value as well as a comparison with similar homes in the area
Home Values in the Area
Average Home Value in this Area
Purchase History
| Date | Buyer | Sale Price | Title Company |
|---|---|---|---|
| Rowe Pamela | $293,000 | -- | |
| Freedman Harvey L | -- | -- | |
| Freedman Harvey L | -- | -- | |
| Freedman Harvey L | $342,000 | -- |
Source: Public Records
Mortgage History
| Date | Status | Borrower | Loan Amount |
|---|---|---|---|
| Open | Rowe Pamela | $287,693 | |
| Previous Owner | Freedman Harvey L | $273,600 |
Source: Public Records
Tax History
| Year | Tax Paid | Tax Assessment Tax Assessment Total Assessment is a certain percentage of the fair market value that is determined by local assessors to be the total taxable value of land and additions on the property. | Land | Improvement |
|---|---|---|---|---|
| 2025 | $7,957 | $492,400 | $119,600 | $372,800 |
| 2024 | $8,070 | $462,200 | $111,400 | $350,800 |
| 2023 | $7,416 | $431,400 | $101,200 | $330,200 |
| 2022 | $6,903 | $354,900 | $103,800 | $251,100 |
| 2021 | $6,723 | $336,500 | $103,800 | $232,700 |
| 2020 | $6,751 | $340,100 | $103,800 | $236,300 |
| 2019 | $6,190 | $313,400 | $103,800 | $209,600 |
| 2018 | $5,748 | $287,700 | $103,800 | $183,900 |
| 2016 | $5,003 | $255,900 | $102,900 | $153,000 |
| 2015 | $4,737 | $252,500 | $102,900 | $149,600 |
| 2014 | $4,673 | $247,100 | $102,900 | $144,200 |
Source: Public Records
Map
Nearby Homes
- 303 Ponakin Rd
- 0 Main St
- 2038-1 Laurel Hill Ln
- 2038 Laurel Hill Ln Unit LOT 18
- 144 Seven Bridge Rd
- 892 Main St
- 18 Highfield Dr
- 2290 Main St
- 1497 Lunenburg Rd
- 73 Prescott St
- 35 Mcgovern Blvd
- 132 Kilbourn Rd
- 76 Mill St Unit 3
- 121 &125 Flanagan Hill Rd
- 7 Lawson Ave
- 2 Turtle Ln Unit 2
- 113 Parker Rd Unit 1
- 0 Parker Rd
- 193 Bayberry Hill Ln
- 171 Bayberry Hill Ln
Your Personal Tour Guide
Ask me questions while you tour the home.