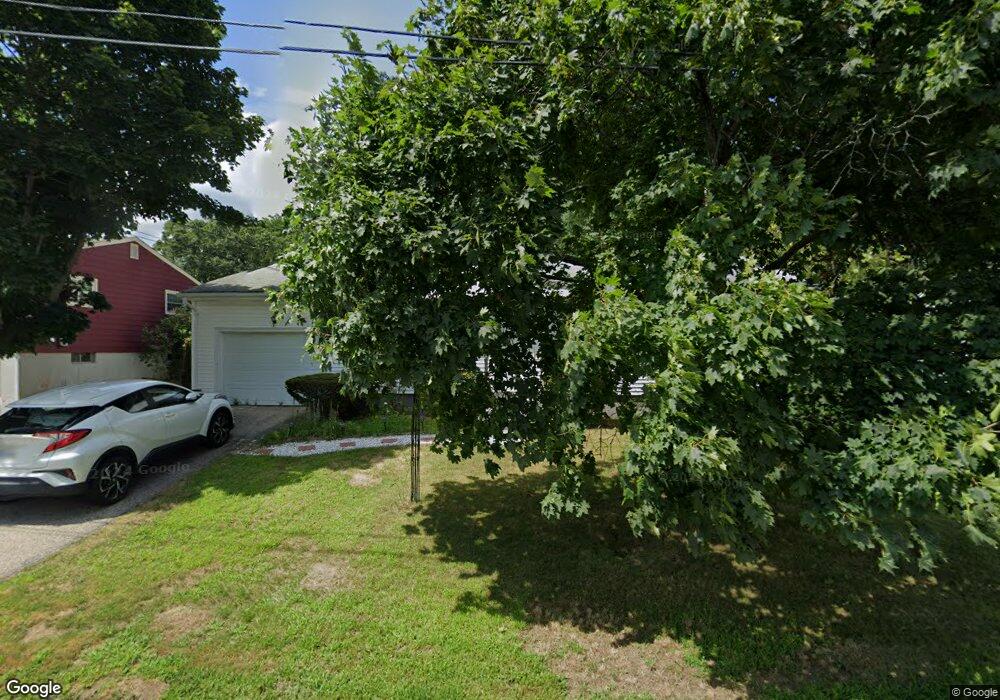
22 Prospect Ave Coventry, RI 02816
Estimated Value: $376,074 - $419,000
3
Beds
1
Bath
1,556
Sq Ft
$251/Sq Ft
Est. Value
About This Home
This home is located at 22 Prospect Ave, Coventry, RI 02816 and is currently estimated at $390,769, approximately $251 per square foot. 22 Prospect Ave is a home located in Kent County with nearby schools including Alan Shawn Feinstein Ms Of Cov, Coventry High School, and Father John V. Doyle School.
Ownership History
Date
Name
Owned For
Owner Type
Purchase Details
Closed on
Oct 25, 2002
Sold by
Steele Christina M
Bought by
Chhay Veasna and Oun Chanmony
Current Estimated Value
Home Financials for this Owner
Home Financials are based on the most recent Mortgage that was taken out on this home.
Original Mortgage
$98,700
Interest Rate
6.2%
Purchase Details
Closed on
Feb 1, 1994
Sold by
Ricci James E and Ricci Sharon
Bought by
Peltier James S and Peltier Lori
Create a Home Valuation Report for This Property
The Home Valuation Report is an in-depth analysis detailing your home's value as well as a comparison with similar homes in the area
Purchase History
| Date | Buyer | Sale Price | Title Company |
|---|---|---|---|
| Chhay Veasna | $167,000 | -- | |
| Peltier James S | $90,000 | -- |
Source: Public Records
Mortgage History
| Date | Status | Borrower | Loan Amount |
|---|---|---|---|
| Open | Peltier James S | $150,000 | |
| Closed | Peltier James S | $50,000 | |
| Closed | Peltier James S | $98,700 | |
| Previous Owner | Peltier James S | $15,000 |
Source: Public Records
Tax History
| Year | Tax Paid | Tax Assessment Tax Assessment Total Assessment is a certain percentage of the fair market value that is determined by local assessors to be the total taxable value of land and additions on the property. | Land | Improvement |
|---|---|---|---|---|
| 2025 | $4,097 | $254,600 | $90,700 | $163,900 |
| 2024 | $4,033 | $254,600 | $90,700 | $163,900 |
| 2023 | $3,903 | $254,600 | $90,700 | $163,900 |
| 2022 | $3,816 | $195,000 | $84,200 | $110,800 |
| 2021 | $3,783 | $195,000 | $84,200 | $110,800 |
| 2020 | $4,337 | $195,000 | $84,200 | $110,800 |
| 2019 | $3,274 | $147,200 | $52,100 | $95,100 |
| 2018 | $3,181 | $147,200 | $52,100 | $95,100 |
| 2017 | $3,088 | $147,200 | $52,100 | $95,100 |
| 2016 | $2,655 | $124,000 | $42,500 | $81,500 |
| 2015 | $2,583 | $124,000 | $42,500 | $81,500 |
| 2014 | $2,529 | $124,000 | $42,500 | $81,500 |
| 2013 | $3,034 | $162,600 | $67,400 | $95,200 |
Source: Public Records
Map
Nearby Homes
Your Personal Tour Guide
Ask me questions while you tour the home.