22 Quarry St Great Barrington, MA 01230
Estimated Value: $731,374 - $840,000
3
Beds
2
Baths
1,680
Sq Ft
$468/Sq Ft
Est. Value
About This Home
This home is located at 22 Quarry St, Great Barrington, MA 01230 and is currently estimated at $785,594, approximately $467 per square foot. 22 Quarry St is a home located in Berkshire County with nearby schools including Muddy Brook Regional Elementary School, W.E.B Du Bois Regional Middle School, and Monument Mountain Regional High School.
Ownership History
Date
Name
Owned For
Owner Type
Purchase Details
Closed on
Jan 13, 2025
Sold by
Quarry St Mgmt Co Llc
Bought by
Debbie F Youngelman Ret and Youngelman
Current Estimated Value
Purchase Details
Closed on
Nov 9, 2018
Sold by
Dousmanis Pete and Dousmanis Christiane
Bought by
Quarry Street Mgmt Co
Home Financials for this Owner
Home Financials are based on the most recent Mortgage that was taken out on this home.
Original Mortgage
$360,000
Interest Rate
4.25%
Mortgage Type
New Conventional
Purchase Details
Closed on
Feb 11, 2005
Sold by
Siegel Stephen A and Hanley Deborah M
Bought by
Holloway Mark W and Holloway Langdon L
Home Financials for this Owner
Home Financials are based on the most recent Mortgage that was taken out on this home.
Original Mortgage
$840,000
Interest Rate
5.83%
Mortgage Type
Purchase Money Mortgage
Create a Home Valuation Report for This Property
The Home Valuation Report is an in-depth analysis detailing your home's value as well as a comparison with similar homes in the area
Home Values in the Area
Average Home Value in this Area
Purchase History
| Date | Buyer | Sale Price | Title Company |
|---|---|---|---|
| Debbie F Youngelman Ret | -- | None Available | |
| Quarry Street Mgmt Co | $450,000 | -- | |
| Holloway Mark W | $1,050,000 | -- |
Source: Public Records
Mortgage History
| Date | Status | Borrower | Loan Amount |
|---|---|---|---|
| Previous Owner | Quarry Street Mgmt Co | $360,000 | |
| Previous Owner | Holloway Mark W | $840,000 |
Source: Public Records
Tax History Compared to Growth
Tax History
| Year | Tax Paid | Tax Assessment Tax Assessment Total Assessment is a certain percentage of the fair market value that is determined by local assessors to be the total taxable value of land and additions on the property. | Land | Improvement |
|---|---|---|---|---|
| 2025 | $7,997 | $579,900 | $156,500 | $423,400 |
| 2024 | $7,523 | $541,600 | $150,300 | $391,300 |
| 2023 | $64 | $508,900 | $150,300 | $358,600 |
| 2022 | $6,436 | $433,100 | $136,600 | $296,500 |
| 2019 | $6,362 | $404,700 | $64,700 | $340,000 |
| 2018 | $5,841 | $389,900 | $64,700 | $325,200 |
| 2017 | $5,693 | $389,900 | $64,700 | $325,200 |
| 2016 | $5,482 | $383,600 | $59,300 | $324,300 |
| 2015 | $5,178 | $377,400 | $59,300 | $318,100 |
Source: Public Records
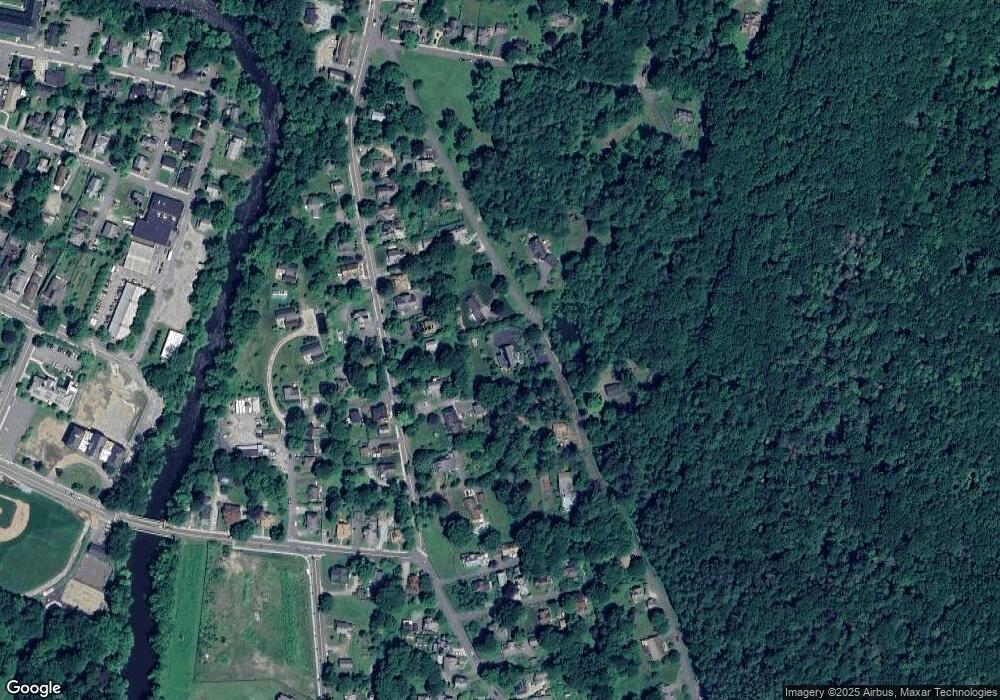
Map
Nearby Homes