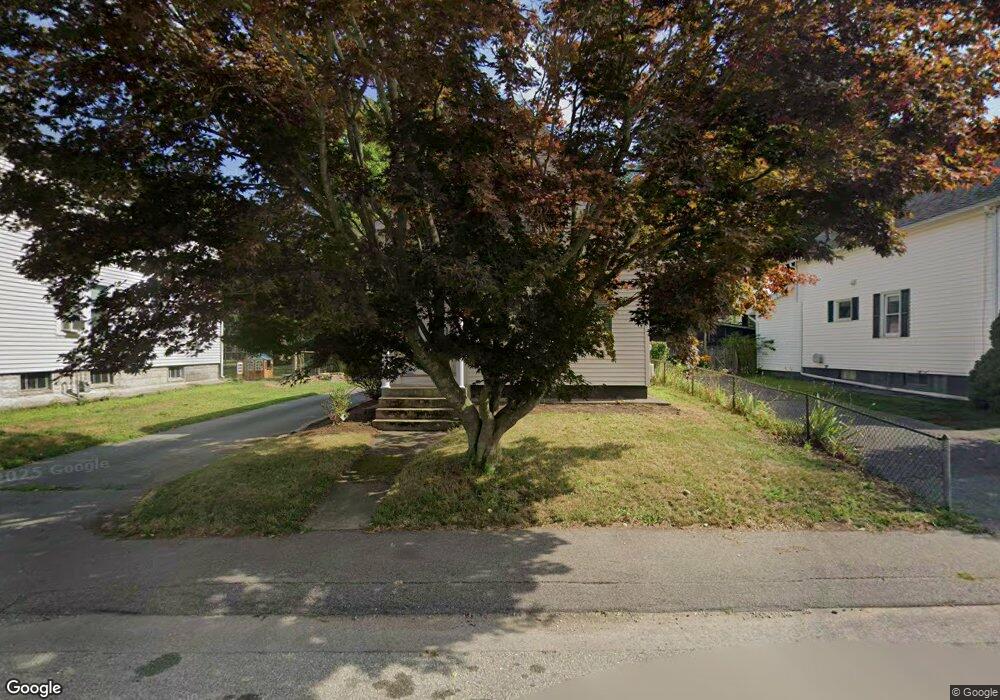
22 Randall St Taunton, MA 02780
City Center NeighborhoodEstimated Value: $350,000 - $430,000
2
Beds
1
Bath
1,117
Sq Ft
$349/Sq Ft
Est. Value
About This Home
This home is located at 22 Randall St, Taunton, MA 02780 and is currently estimated at $389,896, approximately $349 per square foot. 22 Randall St is a home located in Bristol County with nearby schools including H. H. Galligan School, Taunton High School, and John F. Parker Middle School.
Ownership History
Date
Name
Owned For
Owner Type
Purchase Details
Closed on
Mar 14, 2025
Sold by
Gallego Edward F and Gallego Beverly A
Bought by
Longo Brittney and Delano Cody
Current Estimated Value
Home Financials for this Owner
Home Financials are based on the most recent Mortgage that was taken out on this home.
Original Mortgage
$320,625
Outstanding Balance
$318,458
Interest Rate
6.95%
Mortgage Type
Purchase Money Mortgage
Estimated Equity
$71,438
Purchase Details
Closed on
Dec 28, 2007
Sold by
Gallego Beverly A and Gallego Edward F
Bought by
Gallego Beverly A and Gallego Edward F
Purchase Details
Closed on
Oct 24, 2003
Sold by
Gallego Edward R and Gallego Mary R
Bought by
Gallego Edward R and Gallego Mary R
Create a Home Valuation Report for This Property
The Home Valuation Report is an in-depth analysis detailing your home's value as well as a comparison with similar homes in the area
Home Values in the Area
Average Home Value in this Area
Purchase History
| Date | Buyer | Sale Price | Title Company |
|---|---|---|---|
| Longo Brittney | $337,500 | None Available | |
| Longo Brittney | $337,500 | None Available | |
| Gallego Beverly A | -- | -- | |
| Gallego Beverly A | -- | -- | |
| Gallego Edward R | -- | -- | |
| Gallego Edward R | -- | -- |
Source: Public Records
Mortgage History
| Date | Status | Borrower | Loan Amount |
|---|---|---|---|
| Open | Longo Brittney | $320,625 | |
| Closed | Longo Brittney | $320,625 |
Source: Public Records
Tax History Compared to Growth
Tax History
| Year | Tax Paid | Tax Assessment Tax Assessment Total Assessment is a certain percentage of the fair market value that is determined by local assessors to be the total taxable value of land and additions on the property. | Land | Improvement |
|---|---|---|---|---|
| 2025 | $4,567 | $417,500 | $126,500 | $291,000 |
| 2024 | $3,942 | $352,300 | $126,500 | $225,800 |
| 2023 | $3,916 | $325,000 | $126,500 | $198,500 |
| 2022 | $3,747 | $284,300 | $105,400 | $178,900 |
| 2021 | $3,624 | $255,200 | $95,800 | $159,400 |
| 2020 | $3,520 | $236,900 | $95,800 | $141,100 |
| 2019 | $3,426 | $217,400 | $95,800 | $121,600 |
| 2018 | $3,353 | $213,300 | $96,800 | $116,500 |
| 2017 | $3,052 | $194,300 | $91,800 | $102,500 |
| 2016 | $2,965 | $189,100 | $89,100 | $100,000 |
| 2015 | $2,903 | $193,400 | $89,500 | $103,900 |
| 2014 | $2,845 | $194,700 | $89,500 | $105,200 |
Source: Public Records
Map
Nearby Homes
- 5 Dean Ave
- 30 Buffington St
- 31 Church Green Unit 303
- 12 Chestnut St Unit A
- 9 Bradford St
- 54 Adams St
- 48 Taunton Green
- 78 Arlington St Unit 2
- 78 Arlington St Unit 3
- 78 Arlington St Unit 1
- 0, M64 L51 Knapp St
- 0 M64 L39 Knapp St
- 0, M64 L49 Knapp St
- 0, M64 L50 Knapp St
- 14 Wilbur St
- 22 John St Unit 22
- 6 Makepeace Ave
- 37 Winter St
- 46 Harrison St Unit 4
- 9 Jefferson St