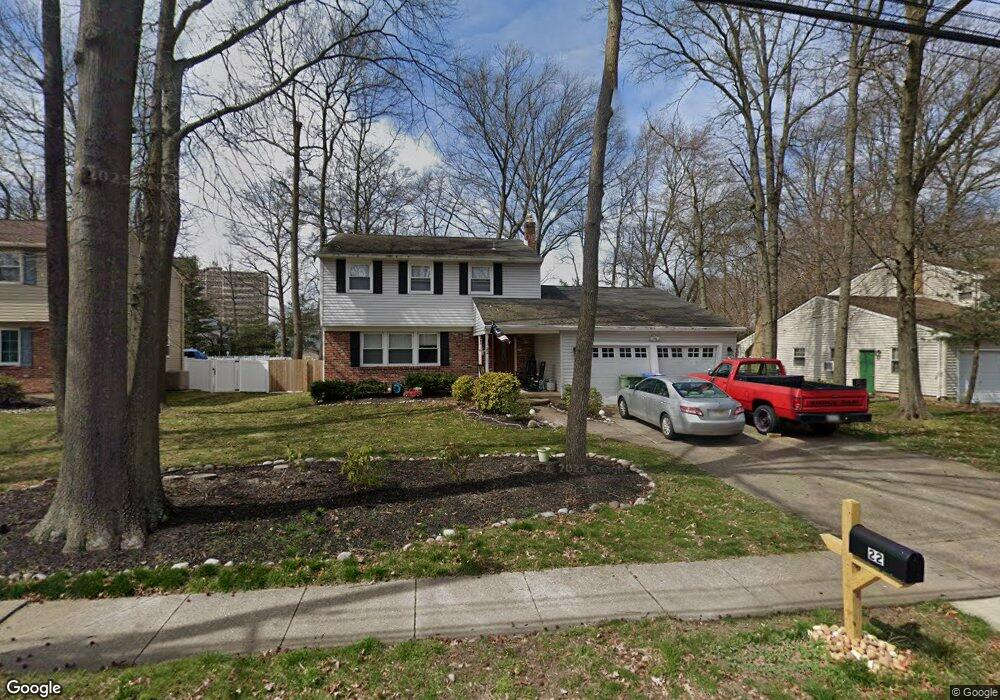
22 Ranoldo Terrace Cherry Hill, NJ 08034
Estimated Value: $521,040 - $603,000
4
Beds
3
Baths
2,144
Sq Ft
$261/Sq Ft
Est. Value
About This Home
This home is located at 22 Ranoldo Terrace, Cherry Hill, NJ 08034 and is currently estimated at $559,260, approximately $260 per square foot. 22 Ranoldo Terrace is a home located in Camden County with nearby schools including Kingston Elementary School, John A Carusi Middle School, and Cherry Hill High-West High School.
Ownership History
Date
Name
Owned For
Owner Type
Purchase Details
Closed on
Oct 13, 2021
Sold by
Cheung Desjardins Scrina
Bought by
Desjardins David R
Current Estimated Value
Purchase Details
Closed on
Dec 21, 2011
Sold by
Desjardins Serina C
Bought by
Desjardins David R and Desjardins Serina C
Purchase Details
Closed on
Aug 21, 2008
Sold by
Skaf Jad G and Skaf Lynda J
Bought by
Cheung Serina
Home Financials for this Owner
Home Financials are based on the most recent Mortgage that was taken out on this home.
Original Mortgage
$305,550
Interest Rate
6.54%
Mortgage Type
New Conventional
Purchase Details
Closed on
Sep 7, 2007
Sold by
Yieh Arh Chiou and Hieh Yali
Bought by
Skaf Jad G and Skaf Lunda J
Home Financials for this Owner
Home Financials are based on the most recent Mortgage that was taken out on this home.
Original Mortgage
$260,000
Interest Rate
6.63%
Mortgage Type
New Conventional
Create a Home Valuation Report for This Property
The Home Valuation Report is an in-depth analysis detailing your home's value as well as a comparison with similar homes in the area
Home Values in the Area
Average Home Value in this Area
Purchase History
| Date | Buyer | Sale Price | Title Company |
|---|---|---|---|
| Desjardins David R | -- | French Sheera | |
| Desjardins David R | -- | French Sheera | |
| Desjardins David R | -- | -- | |
| Cheung Serina | $315,000 | -- | |
| Skaf Jad G | $325,000 | -- |
Source: Public Records
Mortgage History
| Date | Status | Borrower | Loan Amount |
|---|---|---|---|
| Previous Owner | Cheung Serina | $305,550 | |
| Previous Owner | Skaf Jad G | $260,000 |
Source: Public Records
Tax History Compared to Growth
Tax History
| Year | Tax Paid | Tax Assessment Tax Assessment Total Assessment is a certain percentage of the fair market value that is determined by local assessors to be the total taxable value of land and additions on the property. | Land | Improvement |
|---|---|---|---|---|
| 2025 | $10,269 | $230,300 | $59,800 | $170,500 |
| 2024 | $9,677 | $230,300 | $59,800 | $170,500 |
| 2023 | $9,677 | $230,300 | $59,800 | $170,500 |
| 2022 | $9,410 | $230,300 | $59,800 | $170,500 |
| 2021 | $9,440 | $230,300 | $59,800 | $170,500 |
| 2020 | $9,325 | $230,300 | $59,800 | $170,500 |
| 2019 | $9,320 | $230,300 | $59,800 | $170,500 |
| 2018 | $9,295 | $230,300 | $59,800 | $170,500 |
| 2017 | $9,168 | $230,300 | $59,800 | $170,500 |
| 2016 | $9,046 | $230,300 | $59,800 | $170,500 |
| 2015 | $8,903 | $230,300 | $59,800 | $170,500 |
| 2014 | $8,804 | $230,300 | $59,800 | $170,500 |
Source: Public Records
Map
Nearby Homes
- 1007 Chelten Pkwy
- 1111 Barclay Towers
- 405 Barclay Towers
- 917 Deland Ave
- 110 Barclay Ln
- 147 Greenvale Rd
- 205 E Tampa Ave
- 306 Cambridge Rd
- 225 Drake Rd
- 223 Drake Rd
- 225 Cambridge Rd
- 222 Belle Arbor Dr
- 217 Redstone Ridge
- 1217 Forge Rd
- 307 Kingston Rd
- 314 Covered Bridge Rd
- 407 Yorkshire Rd
- 107 Chapel Ave E
- 537 Doe Ln
- 416 Chapel Ave E
- 26 Ranoldo Terrace
- 18 Ranoldo Terrace
- 30 Ranoldo Terrace
- 16 Ranoldo Terrace
- 613 RT 70 W Barclay Towers Unit 613
- 508 Barclay Walk
- 100 Barclay Walk
- 506 Barclay Walk
- 504 Barclay Walk
- 504 Barclay Walk
- 101 Barclay Walk
- 500 Barclay Walk
- 32 Ranoldo Terrace
- 27 Ranoldo Terrace
- 102 Barclay Walk
- 103 Barclay Walk
- 700 Barclay Walk
- 104 Barclay Walk
- 514 Barclay Walk
- 106 Barclay Walk