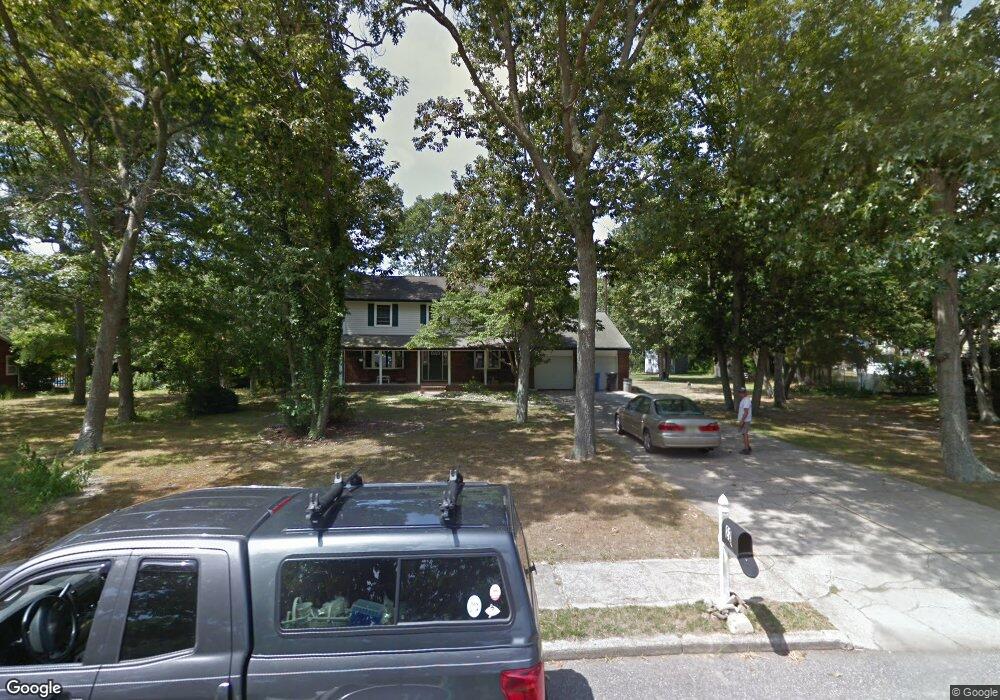
22 Red Oak Dr Ocean View, NJ 08230
Estimated Value: $391,000 - $608,000
Studio
--
Bath
2,229
Sq Ft
$231/Sq Ft
Est. Value
About This Home
This home is located at 22 Red Oak Dr, Ocean View, NJ 08230 and is currently estimated at $515,555, approximately $231 per square foot. 22 Red Oak Dr is a home located in Cape May County with nearby schools including Upper Township Primary School, Upper Township Elementary School, and Upper Township Middle School.
Ownership History
Date
Name
Owned For
Owner Type
Purchase Details
Closed on
Oct 3, 2018
Sold by
Brady Donna M
Bought by
Brady Dennis W
Current Estimated Value
Purchase Details
Closed on
Jan 16, 1998
Sold by
Wolicki Stephen J
Bought by
Brady Dennis W and Brady Donna M
Home Financials for this Owner
Home Financials are based on the most recent Mortgage that was taken out on this home.
Original Mortgage
$141,000
Interest Rate
7.11%
Purchase Details
Closed on
May 6, 1994
Sold by
Crowell William
Bought by
Wolicki Stephen J
Home Financials for this Owner
Home Financials are based on the most recent Mortgage that was taken out on this home.
Original Mortgage
$155,000
Interest Rate
7.7%
Mortgage Type
VA
Purchase Details
Closed on
Jan 27, 1992
Sold by
Mower Richard E and Mower Easter,Anita O
Bought by
Crowell William and Crowell Cheryl
Create a Home Valuation Report for This Property
The Home Valuation Report is an in-depth analysis detailing your home's value as well as a comparison with similar homes in the area
Home Values in the Area
Average Home Value in this Area
Purchase History
| Date | Buyer | Sale Price | Title Company |
|---|---|---|---|
| Brady Dennis W | -- | -- | |
| Brady Dennis W | $157,000 | -- | |
| Wolicki Stephen J | $159,650 | -- | |
| Crowell William | $145,000 | -- |
Source: Public Records
Mortgage History
| Date | Status | Borrower | Loan Amount |
|---|---|---|---|
| Previous Owner | Brady Dennis W | $141,000 | |
| Previous Owner | Wolicki Stephen J | $155,000 |
Source: Public Records
Tax History
| Year | Tax Paid | Tax Assessment Tax Assessment Total Assessment is a certain percentage of the fair market value that is determined by local assessors to be the total taxable value of land and additions on the property. | Land | Improvement |
|---|---|---|---|---|
| 2025 | $7,466 | $325,300 | $135,600 | $189,700 |
| 2024 | $7,466 | $325,300 | $135,600 | $189,700 |
| 2023 | $7,098 | $325,300 | $135,600 | $189,700 |
| 2022 | $6,838 | $325,300 | $135,600 | $189,700 |
| 2021 | $4,880 | $325,300 | $135,600 | $189,700 |
| 2020 | $6,340 | $325,300 | $135,600 | $189,700 |
| 2019 | $6,171 | $325,300 | $135,600 | $189,700 |
| 2018 | $6,008 | $325,300 | $135,600 | $189,700 |
| 2017 | $5,933 | $325,300 | $135,600 | $189,700 |
| 2016 | $5,155 | $277,900 | $135,600 | $142,300 |
| 2015 | $5,016 | $277,900 | $135,600 | $142,300 |
| 2014 | $6,219 | $422,500 | $216,800 | $205,700 |
Source: Public Records
Map
Nearby Homes
- 124 Butter Rd
- 40 Butter Rd
- 5 Klains Ln
- 46 Victoria Ln
- 297 Butter Rd
- 4 Bayview Ave
- 19 Bayview Ave
- 11 Evio John Ct
- 734 Stagecoach Rd
- 731 Oceancrest Ave
- 24 E Timber Dr
- 1729 Shore Rd
- 4 Sandcastle Dr
- 516 N Route 9 Unit B-16
- 516 N Route 9 Unit L-2
- 3 Sandcastle Dr
- 1731 Route 9 Unit 11
- 1731 Route 9 Unit 28
- 1731 Route 9 Unit 25
- 430 S Shore Rd
Your Personal Tour Guide
Ask me questions while you tour the home.