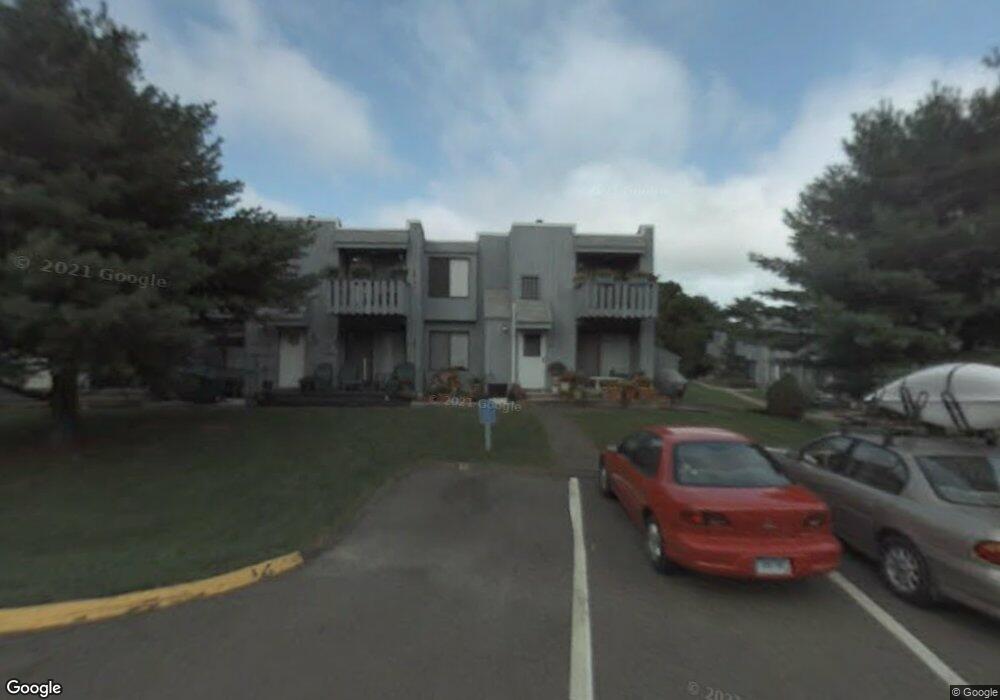
22 Redwood Dr Unit G East Haven, CT 06513
Estimated Value: $199,000 - $287,000
2
Beds
2
Baths
1,066
Sq Ft
$213/Sq Ft
Est. Value
About This Home
This home is located at 22 Redwood Dr Unit G, East Haven, CT 06513 and is currently estimated at $227,415, approximately $213 per square foot. 22 Redwood Dr Unit G is a home located in New Haven County with nearby schools including Deer Run School, East Haven High School, and All Nations Christian Academy.
Ownership History
Date
Name
Owned For
Owner Type
Purchase Details
Closed on
Jun 14, 2005
Sold by
Hinckley Tanya
Bought by
Chmura Lorraine
Current Estimated Value
Home Financials for this Owner
Home Financials are based on the most recent Mortgage that was taken out on this home.
Original Mortgage
$110,800
Interest Rate
5.79%
Purchase Details
Closed on
Apr 28, 2003
Sold by
Parente Curtiss
Bought by
Hinckley Tanya
Home Financials for this Owner
Home Financials are based on the most recent Mortgage that was taken out on this home.
Original Mortgage
$104,700
Interest Rate
5.64%
Purchase Details
Closed on
Apr 25, 2002
Sold by
Ardizonne Frank
Bought by
Parente Curtiss
Home Financials for this Owner
Home Financials are based on the most recent Mortgage that was taken out on this home.
Original Mortgage
$59,350
Interest Rate
7.05%
Create a Home Valuation Report for This Property
The Home Valuation Report is an in-depth analysis detailing your home's value as well as a comparison with similar homes in the area
Home Values in the Area
Average Home Value in this Area
Purchase History
| Date | Buyer | Sale Price | Title Company |
|---|---|---|---|
| Chmura Lorraine | $138,500 | -- | |
| Hinckley Tanya | $108,000 | -- | |
| Parente Curtiss | $62,500 | -- |
Source: Public Records
Mortgage History
| Date | Status | Borrower | Loan Amount |
|---|---|---|---|
| Open | Parente Curtiss | $76,400 | |
| Closed | Parente Curtiss | $110,800 | |
| Previous Owner | Parente Curtiss | $104,700 | |
| Previous Owner | Parente Curtiss | $59,350 |
Source: Public Records
Tax History Compared to Growth
Tax History
| Year | Tax Paid | Tax Assessment Tax Assessment Total Assessment is a certain percentage of the fair market value that is determined by local assessors to be the total taxable value of land and additions on the property. | Land | Improvement |
|---|---|---|---|---|
| 2025 | $2,399 | $71,750 | $0 | $71,750 |
| 2024 | $2,399 | $71,750 | $0 | $71,750 |
| 2023 | $2,239 | $71,750 | $0 | $71,750 |
| 2022 | $2,239 | $71,750 | $0 | $71,750 |
| 2021 | $1,745 | $50,960 | $0 | $50,960 |
| 2020 | $1,745 | $50,960 | $0 | $50,960 |
| 2019 | $1,652 | $50,960 | $0 | $50,960 |
| 2018 | $1,654 | $50,960 | $0 | $50,960 |
| 2017 | $1,608 | $50,960 | $0 | $50,960 |
| 2016 | $2,539 | $80,470 | $0 | $80,470 |
| 2015 | $2,539 | $80,470 | $0 | $80,470 |
| 2014 | $2,579 | $80,470 | $0 | $80,470 |
Source: Public Records
Map
Nearby Homes
- 75 Redwood Dr Unit 609
- 15 Cedar Ct Unit G
- 6 Birch Ln Unit L
- 3 Timberland Dr
- 140 Thompson St Unit 16E
- 140 Thompson St Unit 14A
- 140 Thompson St Unit 13C
- 140 Thompson St Unit 5B
- 167 Foxon Hill Rd
- 7 Jeffrey Rd
- 7 Oak Hill Dr
- 15 Zolan Dr
- 90 Foxon Blvd
- 300 Foxon Hill Rd
- 12 Corbin Rd
- 13 Rabbit Rock Rd
- 173 Russo Ave Unit 609
- 173 Russo Ave Unit 610
- 173 Russo Ave Unit 409
- 66 John St
- 22 Redwood Dr Unit C
- 22 Redwood Dr Unit A
- 22 Redwood Dr Unit E
- 22 Redwood Dr Unit H
- 22 Redwood Dr Unit I
- 22 Redwood Dr Unit D
- 22 Redwood Dr Unit J
- 22 Redwood Dr Unit F
- 22 Redwood Dr Unit B
- 22 Redwood Dr Unit 22B
- 22 Redwood Dr
- 22 Redwood Dr Unit 22A
- 27 Redwood Dr Unit C
- 27 Redwood Dr Unit D
- 27 Redwood Dr Unit B
- 27 Redwood Dr Unit H
- 27 Redwood Dr Unit E
- 27 Redwood Dr Unit F
- 27 Redwood Dr Unit G
- 27 Redwood Dr Unit A