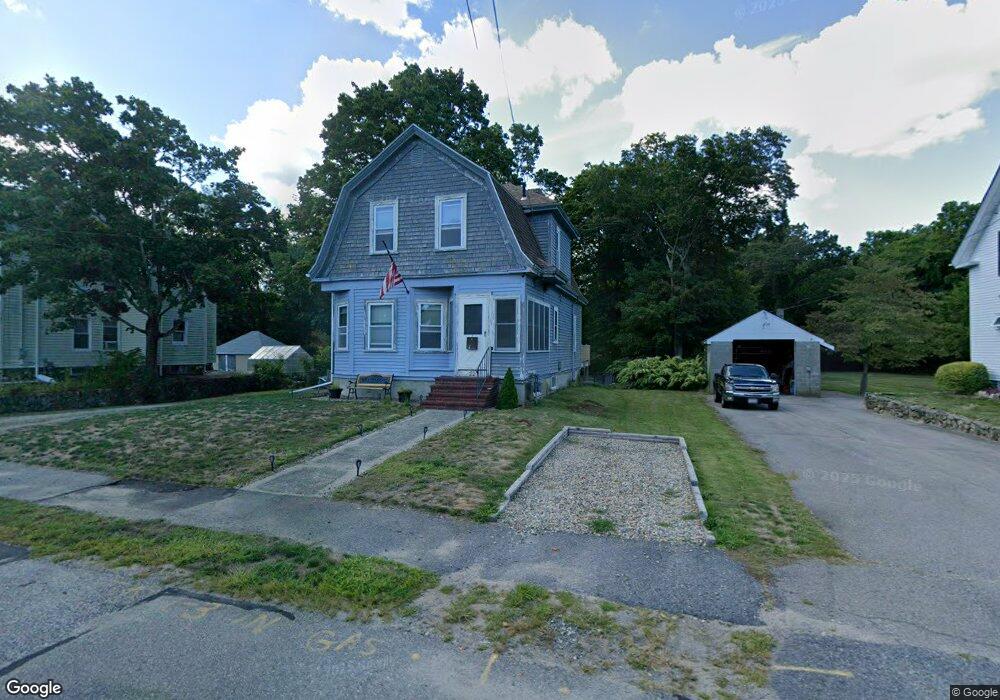
22 Rice St Middleboro, MA 02346
Estimated Value: $401,000 - $473,000
2
Beds
1
Bath
1,537
Sq Ft
$291/Sq Ft
Est. Value
About This Home
This home is located at 22 Rice St, Middleboro, MA 02346 and is currently estimated at $446,584, approximately $290 per square foot. 22 Rice St is a home located in Plymouth County with nearby schools including Mary K. Goode Elementary School and Mullein Hill Christian Academy.
Ownership History
Date
Name
Owned For
Owner Type
Purchase Details
Closed on
Jun 8, 2023
Sold by
Gaitan Nikkie L and Broadbent Randy K
Bought by
Broadbent Randy K
Current Estimated Value
Home Financials for this Owner
Home Financials are based on the most recent Mortgage that was taken out on this home.
Original Mortgage
$282,200
Outstanding Balance
$273,504
Interest Rate
6.43%
Mortgage Type
New Conventional
Estimated Equity
$173,080
Purchase Details
Closed on
Apr 3, 2023
Sold by
Broadbent Beth A Est and Gaitan
Bought by
Gaitan Nikkie L and Broadbent Randy K
Purchase Details
Closed on
May 20, 1974
Bought by
Broadbent Steven and Broadbent Beth
Create a Home Valuation Report for This Property
The Home Valuation Report is an in-depth analysis detailing your home's value as well as a comparison with similar homes in the area
Home Values in the Area
Average Home Value in this Area
Purchase History
| Date | Buyer | Sale Price | Title Company |
|---|---|---|---|
| Broadbent Randy K | -- | None Available | |
| Broadbent Randy K | -- | None Available | |
| Gaitan Nikkie L | -- | None Available | |
| Gaitan Nikkie L | -- | None Available | |
| Broadbent Steven | -- | -- |
Source: Public Records
Mortgage History
| Date | Status | Borrower | Loan Amount |
|---|---|---|---|
| Open | Broadbent Randy K | $282,200 | |
| Closed | Broadbent Randy K | $282,200 | |
| Previous Owner | Broadbent Steven | $35,000 | |
| Previous Owner | Broadbent Steven | $50,000 | |
| Previous Owner | Broadbent Steven | $50,000 |
Source: Public Records
Tax History
| Year | Tax Paid | Tax Assessment Tax Assessment Total Assessment is a certain percentage of the fair market value that is determined by local assessors to be the total taxable value of land and additions on the property. | Land | Improvement |
|---|---|---|---|---|
| 2025 | $5,098 | $380,200 | $167,400 | $212,800 |
| 2024 | $4,773 | $352,500 | $159,400 | $193,100 |
| 2023 | $4,786 | $336,100 | $159,400 | $176,700 |
| 2022 | $4,453 | $289,500 | $138,700 | $150,800 |
| 2021 | $4,251 | $261,300 | $121,700 | $139,600 |
| 2020 | $3,976 | $250,400 | $121,700 | $128,700 |
| 2019 | $3,732 | $241,100 | $121,700 | $119,400 |
| 2018 | $3,602 | $230,900 | $115,900 | $115,000 |
| 2017 | $3,387 | $214,800 | $111,500 | $103,300 |
| 2016 | $3,399 | $213,500 | $102,000 | $111,500 |
| 2015 | $3,276 | $207,600 | $102,000 | $105,600 |
Source: Public Records
Map
Nearby Homes
Your Personal Tour Guide
Ask me questions while you tour the home.