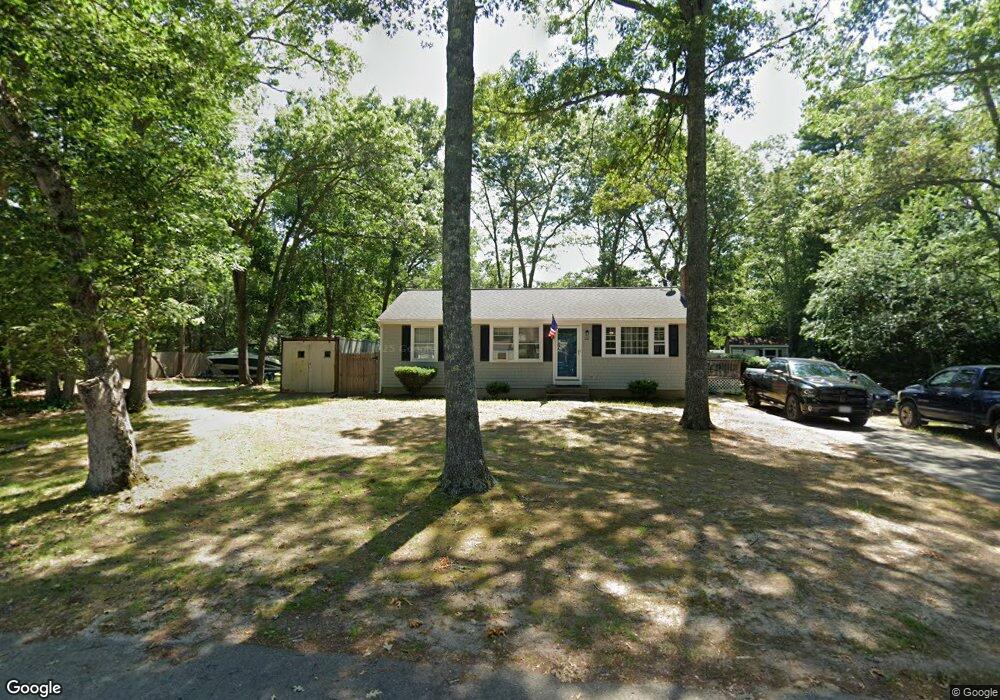
22 Rickard St Carver, MA 02330
Estimated Value: $482,000 - $513,000
3
Beds
1
Bath
960
Sq Ft
$515/Sq Ft
Est. Value
About This Home
This home is located at 22 Rickard St, Carver, MA 02330 and is currently estimated at $494,220, approximately $514 per square foot. 22 Rickard St is a home located in Plymouth County with nearby schools including Carver Elementary School and Samuel Fuller School.
Ownership History
Date
Name
Owned For
Owner Type
Purchase Details
Closed on
Dec 28, 1998
Sold by
Fiore Lisa A
Bought by
Mcginnis Gregory G
Current Estimated Value
Home Financials for this Owner
Home Financials are based on the most recent Mortgage that was taken out on this home.
Original Mortgage
$134,673
Outstanding Balance
$30,173
Interest Rate
6.89%
Mortgage Type
Purchase Money Mortgage
Estimated Equity
$464,047
Create a Home Valuation Report for This Property
The Home Valuation Report is an in-depth analysis detailing your home's value as well as a comparison with similar homes in the area
Home Values in the Area
Average Home Value in this Area
Purchase History
| Date | Buyer | Sale Price | Title Company |
|---|---|---|---|
| Mcginnis Gregory G | $135,900 | -- |
Source: Public Records
Mortgage History
| Date | Status | Borrower | Loan Amount |
|---|---|---|---|
| Open | Mcginnis Gregory G | $134,673 |
Source: Public Records
Tax History Compared to Growth
Tax History
| Year | Tax Paid | Tax Assessment Tax Assessment Total Assessment is a certain percentage of the fair market value that is determined by local assessors to be the total taxable value of land and additions on the property. | Land | Improvement |
|---|---|---|---|---|
| 2025 | $5,472 | $394,500 | $131,100 | $263,400 |
| 2024 | $5,210 | $367,700 | $128,500 | $239,200 |
| 2023 | $5,041 | $345,500 | $128,500 | $217,000 |
| 2022 | $4,752 | $297,400 | $109,900 | $187,500 |
| 2021 | $4,433 | $261,700 | $98,100 | $163,600 |
| 2020 | $4,222 | $245,600 | $91,700 | $153,900 |
| 2019 | $4,072 | $238,800 | $89,000 | $149,800 |
| 2018 | $3,831 | $217,300 | $89,000 | $128,300 |
| 2017 | $3,671 | $207,500 | $85,700 | $121,800 |
| 2016 | $3,375 | $198,200 | $81,600 | $116,600 |
| 2015 | $3,218 | $189,200 | $81,600 | $107,600 |
| 2014 | $3,278 | $192,700 | $103,100 | $89,600 |
Source: Public Records
Map
Nearby Homes
- 23 Shaw St
- 35 Silva St
- 7 Green St
- 11 Brockton Ave
- 26 Santana Way Unit 26
- 135 Plymouth St
- 81 Center St
- 18 Russell Holmes Way
- Lot1 Elk Run Dr
- 269 Purchase St
- 141 Rocky Meadow St
- 6 Susan Cir
- 5 Carver Square Blvd Unit 5
- 5 Carver Square Blvd
- 235 Main St
- 64 Wenham Rd
- 6 Kestrel Way
- 122 High St
- 759 Plymouth St
- 9 Terrace Way