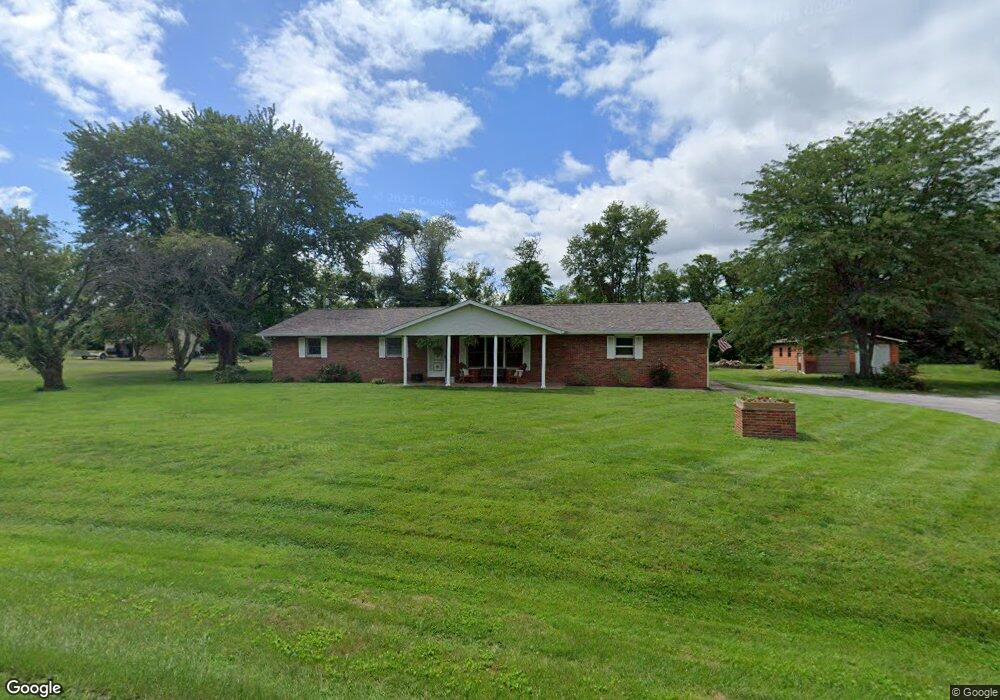
22 Rickhaven Dr Collinsville, IL 62234
Estimated Value: $244,000 - $279,000
3
Beds
2
Baths
1,494
Sq Ft
$174/Sq Ft
Est. Value
About This Home
This home is located at 22 Rickhaven Dr, Collinsville, IL 62234 and is currently estimated at $260,454, approximately $174 per square foot. 22 Rickhaven Dr is a home located in Madison County with nearby schools including Silver Creek Elementary School, Triad Middle School, and Triad High School.
Ownership History
Date
Name
Owned For
Owner Type
Purchase Details
Closed on
Apr 3, 2020
Sold by
Plemons Timothy and Plemons Brittany
Bought by
Sisson Joshua
Current Estimated Value
Home Financials for this Owner
Home Financials are based on the most recent Mortgage that was taken out on this home.
Original Mortgage
$159,595
Outstanding Balance
$139,588
Interest Rate
2.75%
Mortgage Type
New Conventional
Estimated Equity
$120,866
Purchase Details
Closed on
Oct 31, 2013
Sold by
Marchetti Gary L and Mcadams Karen K
Bought by
Plemons Timothy and Hayes Brittany
Home Financials for this Owner
Home Financials are based on the most recent Mortgage that was taken out on this home.
Original Mortgage
$132,063
Interest Rate
3.75%
Mortgage Type
FHA
Purchase Details
Closed on
Dec 26, 2012
Sold by
Marchetti Gary L and Marchetti Karen K
Bought by
Marchetti Gary L and Mcadams Karen K
Purchase Details
Closed on
Apr 5, 2011
Sold by
Marchetti Gary L and Mcadams Karen K
Bought by
Marchetti Gary L and Mcadams Karen K
Create a Home Valuation Report for This Property
The Home Valuation Report is an in-depth analysis detailing your home's value as well as a comparison with similar homes in the area
Home Values in the Area
Average Home Value in this Area
Purchase History
| Date | Buyer | Sale Price | Title Company |
|---|---|---|---|
| Sisson Joshua | $158,000 | Abstracts & Titles | |
| Plemons Timothy | $134,500 | Abstract & Titles Inc | |
| Marchetti Gary L | -- | None Available | |
| Marchetti Gary L | -- | None Available |
Source: Public Records
Mortgage History
| Date | Status | Borrower | Loan Amount |
|---|---|---|---|
| Open | Sisson Joshua | $159,595 | |
| Previous Owner | Plemons Timothy | $132,063 |
Source: Public Records
Tax History Compared to Growth
Tax History
| Year | Tax Paid | Tax Assessment Tax Assessment Total Assessment is a certain percentage of the fair market value that is determined by local assessors to be the total taxable value of land and additions on the property. | Land | Improvement |
|---|---|---|---|---|
| 2024 | $4,052 | $68,790 | $14,300 | $54,490 |
| 2023 | $4,052 | $62,450 | $12,980 | $49,470 |
| 2022 | $3,733 | $57,500 | $11,950 | $45,550 |
| 2021 | $3,445 | $54,650 | $11,360 | $43,290 |
| 2020 | $3,792 | $52,080 | $11,070 | $41,010 |
| 2019 | $3,741 | $51,010 | $10,840 | $40,170 |
| 2018 | $3,659 | $47,250 | $10,040 | $37,210 |
| 2017 | $3,548 | $46,260 | $9,830 | $36,430 |
| 2016 | $3,060 | $46,260 | $9,830 | $36,430 |
| 2015 | $3,276 | $44,720 | $9,500 | $35,220 |
| 2014 | $3,276 | $44,720 | $9,500 | $35,220 |
| 2013 | $3,276 | $44,720 | $9,500 | $35,220 |
Source: Public Records
Map
Nearby Homes
- 7302 W Kirsch Rd
- 7001 Lockmann Rd
- 2033 Mapleleaf Dr
- 189 Meyer Dr
- 1205 Antler Dr
- 1322 Leland St
- 226 Woodridge Ct
- 1315 Lester Ave
- 131 E Country Ln
- 112 Crestmoor St
- 6430 Lebanon Rd
- 1002 California Ave
- 8014 Charleston
- 1232 Wentworth Ct
- 300 Pine Lake Rd Unit 6
- 300 Pine Lake Rd Unit 7
- 8010 Austin Dr
- 892 Lester Ave
- 1232 Scuddler
- 28 Woodford Way
- 23 Rickhaven Dr
- 21 Rickhaven Dr
- 35 Rickhaven Dr
- 34 Rickhaven Dr
- 20 Westcourt St
- 36 Rickhaven Dr
- 17 Rickhaven Dr
- 24 Rickhaven Dr
- 18 Westcourt St
- 33 Rickhaven Dr
- 19 Westcourt St
- 37 Rickhaven Dr
- 16 Rickhaven Dr
- 15 Northland Dr
- 25 Rickhaven Dr
- 14 Northland Dr
- 38 Rickhaven Dr
- 26 Rickhaven Dr
- 8 Northland Dr
- 7 Northland Dr